Download
1 / 1
10 likes | 139 Views
The Distribution of Chromosomal Aberrations in Human Cells as Predicted by a Generalized Time-Dependent Model of Radiation-Induced Aberration Formation A . L. Ponomarev 1, 3 , K. George 1,3 , F . A. Cucinotta 3 1 USRA, 3600 Bay Area Blvd., Houston, TX 77058

E N D
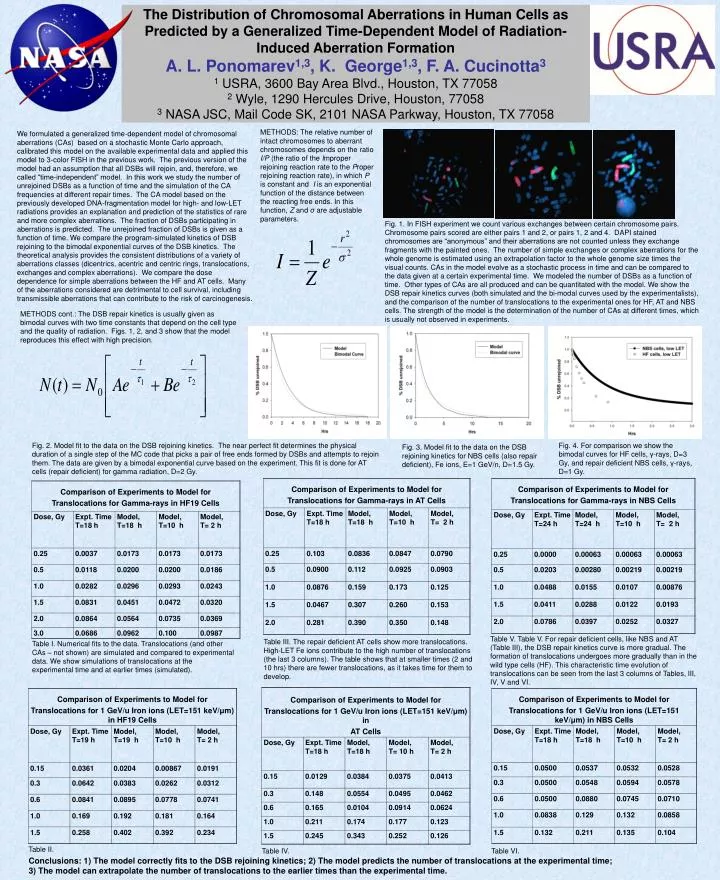
The Distribution of Chromosomal Aberrations in Human Cells as Predicted by a Generalized Time-Dependent Model of Radiation-Induced Aberration Formation A. L. Ponomarev1,3, K. George1,3, F. A. Cucinotta3 1 USRA, 3600 Bay Area Blvd., Houston, TX 77058 2 Wyle, 1290 Hercules Drive, Houston, 77058 3 NASA JSC, Mail Code SK, 2101 NASA Parkway, Houston, TX 77058 METHODS: The relative number of intact chromosomes to aberrant chromosomes depends on the ratio I/P (the ratio of the Improper rejoining reaction rate to the Proper rejoining reaction rate), in which P is constant and I is an exponential function of the distance between the reacting free ends. In this function, Z and σ are adjustable parameters. We formulated a generalized time-dependent model of chromosomal aberrations (CAs) based on a stochastic Monte Carlo approach, calibrated this model on the available experimental data and applied this model to 3-color FISH in the previous work. The previous version of the model had an assumption that all DSBs will rejoin, and, therefore, we called “time-independent” model. In this work we study the number of unrejoined DSBs as a function of time and the simulation of the CA frequencies at different repair times. The CA model based on the previously developed DNA-fragmentation model for high- and low-LET radiations provides an explanation and prediction of the statistics of rare and more complex aberrations. The fraction of DSBs participating in aberrations is predicted. The unrejoined fraction of DSBs is given as a function of time. We compare the program-simulated kinetics of DSB rejoining to the bimodal exponential curves of the DSB kinetics. The theoretical analysis provides the consistent distributions of a variety of aberrations classes (dicentrics, acentric and centric rings, translocations, exchanges and complex aberrations). We compare the dose dependence for simple aberrations between the HF and AT cells. Many of the aberrations considered are detrimental to cell survival, including transmissible aberrations that can contribute to the risk of carcinogenesis. Fig. 1. In FISH experiment we count various exchanges between certain chromosome pairs. Chromosome pairs scored are either pairs 1 and 2, or pairs 1, 2 and 4. DAPI stained chromosomes are “anonymous” and their aberrations are not counted unless they exchange fragments with the painted ones. The number of simple exchanges or complex aberrations for the whole genome is estimated using an extrapolation factor to the whole genome size times the visual counts. CAs in the model evolve as a stochastic process in time and can be compared to the data given at a certain experimental time. We modeled the number of DSBs as a function of time. Other types of CAs are all produced and can be quantitated with the model. We show the DSB repair kinetics curves (both simulated and the bi-modal curves used by the experimentalists), and the comparison of the number of translocations to the experimental ones for HF, AT and NBS cells. The strength of the model is the determination of the number of CAs at different times, which is usually not observed in experiments. METHODS cont.: The DSB repair kinetics is usually given as bimodal curves with two time constants that depend on the cell type and the quality of radiation. Figs. 1, 2, and 3 show that the model reproduces this effect with high precision. Fig. 2. Model fit to the data on the DSB rejoining kinetics. The near perfect fit determines the physical duration of a single step of the MC code that picks a pair of free ends formed by DSBs and attempts to rejoin them. The data are given by a bimodal exponential curve based on the experiment. This fit is done for AT cells (repair deficient) for gamma radiation, D=2 Gy. Fig. 4. For comparison we show the bimodal curves for HF cells, γ-rays, D=3 Gy, and repair deficient NBS cells, γ-rays, D=1 Gy. Fig. 3. Model fit to the data on the DSB rejoining kinetics for NBS cells (also repair deficient), Fe ions, E=1 GeV/n, D=1.5 Gy. Table V. Table V. For repair deficient cells, like NBS and AT (Table III), the DSB repair kinetics curve is more gradual. The formation of translocations undergoes more gradually than in the wild type cells (HF). This characteristic time evolution of translocations can be seen from the last 3 columns of Tables, III, IV, V and VI. Table III. The repair deficient AT cells show more translocations. High-LET Fe ions contribute to the high number of translocations (the last 3 columns). The table shows that at smaller times (2 and 10 hrs) there are fewer translocations, as it takes time for them to develop. Table I. Numerical fits to the data. Translocations (and other CAs – not shown) are simulated and compared to experimental data. We show simulations of translocations at the experimental time and at earlier times (simulated). Table II. Table IV. Table VI. Conclusions: 1) The model correctly fits to the DSB rejoining kinetics; 2) The model predicts the number of translocations at the experimental time; 3) The model can extrapolate the number of translocations to the earlier times than the experimental time.