Download
1 / 26
270 likes | 443 Views
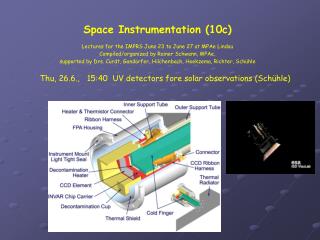
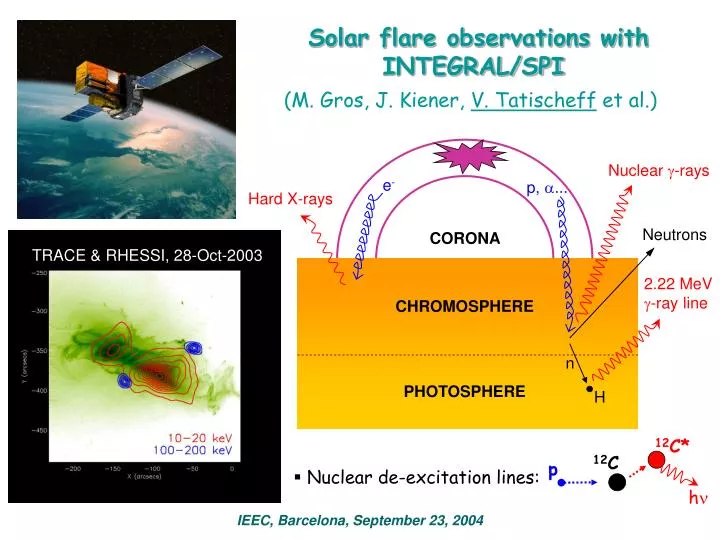
Solar flare observations with INTEGRAL/SPI. (M. Gros, J. Kiener, V. Tatischeff et al.). Nuclear g -rays. e -. p, a. Hard X-rays. Neutrons. CORONA. TRACE & RHESSI, 28-Oct-2003. 2.22 MeV g -ray line. CHROMOSPHERE. n. PHOTOSPHERE. H. 12 C*. 12 C. p.

E N D
Solar flare observations with INTEGRAL/SPI (M. Gros, J. Kiener, V. Tatischeff et al.) Nuclear g-rays e- p, a... Hard X-rays Neutrons CORONA TRACE & RHESSI, 28-Oct-2003 2.22 MeV g-ray line CHROMOSPHERE n PHOTOSPHERE H 12C* 12C p • Nuclear de-excitation lines: hn IEEC, Barcelona, September 23, 2004
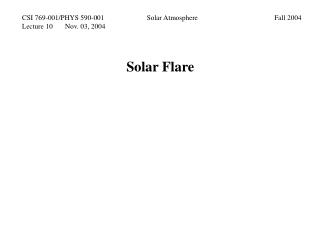
Masks BGO shield ISGRI (CdTe) PICSIT (CsI) Ge detector matrix The INTEGRAL satellite • Scientific objectives: AGN, g-ray bursts, compact objects, novae, SNe, interstellar g-ray emissions... • Launched (Proton) on 17 Oct 2002 IEEC, Barcelona, September 23, 2004
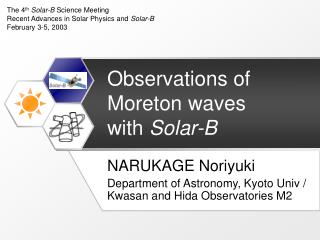
Interest of SPI for solar flare physics • Compact array of 19 hexagonal Ge detectors (Stot=500 cm2): good efficiency at high energy (compared to RHESSI) using "multiple events" • Anti-Coincidence veto System (ACS) of 91 BGO scintillator crystals: Spro~6000–9000 cm2 IEEC, Barcelona, September 23, 2004
Masks BGO shield 32 ° ISGRI PICSIT Ge detector matrix BGO shield SPI observations of the 2003 Oct 28 solar flare (X17.2) • During INTEGRAL observation of IC443 (rev 127; PI: A. Bykov) • Simulated response function for the satellite configuration during the flare: in progress(Weidenspointner et al.) • All results are preliminary IEEC, Barcelona, September 23, 2004
Measured spectra and time history pair prod. mostly instrumental • With all types of Ge events (including multiples 2-5) IEEC, Barcelona, September 23, 2004
Compton 4.44 and 6.13 MeV line characteristics + 0.23 - 0.22 + 0.95 - 0.65 + 0.24 - 0.29 + 1.11 - 0.83 • RHESSI results are for the 23 July, 2002 X4.8 flare (73° helio. angle)-Smith et al. 2003 IEEC, Barcelona, September 23, 2004
common best fit 12C best fit 95.4 % C.L. 90 % C.L. 68.3 % C.L. common best fit 16O best fit 4.44 and 6.13 MeV line shape calculations • Detailed model based on laboratory data • Sensitive to the angular distributionof theacceleratedparticlesandthea/pratio • Best fit results: • 12C only : a/p = 0.00DQ = 20° • 16O only : a/p = 0.09 DQ = 34° • 12C +16O : a/p = 0.03 DQ = 29° IEEC, Barcelona, September 23, 2004
The 6.92 and 7.12 MeV lines of 16O* • Fit with a fixed line shape: same relative redshift and FWHM as for the 6.13 MeV line • The two 16O* lines at ~7 MeV are resolved for the first time • From a simplified model of solar g-ray absorption: IEEC, Barcelona, September 23, 2004
Gamma-ray line ratios • Fast ion composition: Solar Energetic Particles (SEP) from impulsive flares • Fast ion energy spectrum: dN/dE E-S • Nuclear de-excitation lines (thick target production model) compared to 2.22 MeV line production (Hua et al. 2002) DS ? Smin for a/p=0.1 Smax for a/p=0.1 IEEC, Barcelona, September 23, 2004
With a stochastic acceleration spectrum The source spectrum should be a modified Bessel function rather than a power law (e.g. Forman et al. 1986). no improvement for C/O a: acceleration efficiency T: escape time from the acceleration region ? IEEC, Barcelona, September 23, 2004
With SMM and OSSE data • 9 SMM flares with strong (and complete) g-ray line emission (SM95) • OSSE: 1991 June 4 flare (Murphy et al. 1997) • RHESSI results not yet taken into account DS determination for the 1989 Nov 15 flare Correction for heliocentric angle ? IEEC, Barcelona, September 23, 2004
The 12C/16O line ratio problem from Ramaty et al. • Calculated F(4.44)/F(6.13) overestimates by a factor of ~1.5 the average line ratio obtained from SMM, OSSE and SPI data. • Origin of the problem: - the interaction model ? - the cross sections ? - the abundances of 12C and 16O in the ambient medium (coronal, from gradual event SEP) ? • comparison with the 2 other significant lines detected with SMM and OSSE: at 1.37 (24Mg*) and 1.63 MeV (20Ne*) IEEC, Barcelona, September 23, 2004
Cross sections (1) Mainly from KMR02 (ApJ Suppl), the figures. • 4.44 MeV lineS=3S=4.5 a: 12C(p,p’)12C*47.4%43.1% b: 14N(p,x)12C* () 1.6% 0.2% c: 16O(p,x)12C*35.7%9.5% d: 12C(,’)12C*8.7%39.3% e: 14N(,x)12C* () 0.4% 0.3% f: 16O(,x)12C*6.3%7.5% A(b,c)D: cross section measured by the g-ray method (10–20% uncertainties) (with a/p=0.1) (): Cross sections overestimated in KMR02 ; calculated with EMPIRE-II (nuclear statistical model) IEEC, Barcelona, September 23, 2004
Cross sections (2) • 6.13 MeV line 6.129 MeV (16O*) + 6.175 MeV (15O*), but not the 6.322 MeV line (15N*), see Mandzhavidze et al. (1999). S=3S=4.5 a: 16O(p,p’)16O*67.0%42.7% b: 20Ne(p,x)16O* 6.0% 1.6% c: 16O(p,x)15O* 11.0% 0.5% d: 16O(,’)16O*15.2%54.4% e: 20Ne(,x)16O* () 0.6% 0.8% f: 16O(,x)15O* <0.1% <0.1% (): Cross section not considered in KMR02, calculated with EMPIRE-II IEEC, Barcelona, September 23, 2004
Cross sections (3) • 7 MeV lines 6.92 MeV + 7.12 MeV (16O*) S=3S=4.5 a: 16O(p,p’)16O*6.9278.0%40.0% c: 16O(,’)16O*6.9222.0%60.0% b: 16O(p,p’)16O*7.1287.1%52.3% d: 16O(,’)16O*7.1212.9%47.7% • Minor contributions (neglected) from 20Ne spallation (EMPIRE-II) IEEC, Barcelona, September 23, 2004
Cross sections (4) • 1.63 MeV line 1.634 MeV (20Ne*) + 1.636 MeV (23Na*) + 1.635 MeV (14N*) S=3S=4.5 a: 20Ne(p,p’)20Ne*55.1%62.1% b: 24Mg(p,x)20Ne*,23Na* 20.5% 4.1% c: 28Si(p,x)20Ne* 5.3% 0.5% d: 20Ne(,’)20Ne*7.0%27.1% e: 24Mg(a,x)20Ne*,23Na* 2.5% 1.3% a’: 14N(p,p’)14N* 4.1%2.9% b’: 16O(p,x)14N* 4.9% 0.3% c’: 14N(,’)14N*0.6%1.8% IEEC, Barcelona, September 23, 2004
Cross sections (5) • 1.37 MeV line 1.369 MeV (24Mg*) + 1.370 MeV (55Fe*) + 1.367 MeV (59Ni*) S=3S=4.5 a: 24,25,26Mg(p,x)24Mg*85.8%74.5% b: 28Si(p,x)24Mg*7.2%0.9% c: 56Fe(p,x)55Fe* 1.1% 0.1% d: 24Mg(,’)24Mg*5.3%22.2% e: 56Fe(a,n)59Ni* 0.6% 2.3% IEEC, Barcelona, September 23, 2004
With the 1.63 and 1.37 MeV lines • etheory=20% (due to s) added in quadrature to edata for the 2probabilities • Goodness-of-fits: • Ambient medium coronal • but ASEP(C) is too high • a/p=0.1 is favored. Then Ne/O0.15 and Mg/O0.20 The Dec 16, 1988 Flare. Not included in the probability calculations. Ambient photosph. ? IEEC, Barcelona, September 23, 2004
The Dec 16, 1988 Flare. Not included in the probability calculations. Ambient photosph. ? With DS from F2.22/F6.13 only • same results, but on average the probabilities are slightly lower as DS IEEC, Barcelona, September 23, 2004
The C abondance in the interaction region With a/p=0.1 (C/O)SEP=0.460.01 (Reames 1999) (C/O)pho=0.500.08 (Lodders 2003) • Good consistency of the 3 probability distributions • From maximum likelywood: (C/O) = 0.28 0.03 (1s) 0.28 0.08 (2s) IEEC, Barcelona, September 23, 2004
A new photospheric C abundance ? speculative • (C/O)chr~0.3 but (C/O)pho=0.5 ? • Apho(C) and Apho(O) are uncertain: recent substantial revisions (NLTE, 3D models) • A reduced Asol(C) would better fit the C abondance gradient in the Galactic disk (see Hou et al. 2000, fig. 6) • Anders & Grevesse (1989) • Grevesse & Sauval (1998) • Holvecker (2001) • Lodders (2003) • Asplund et al. (2004), A&A for O, in prep. for C for a/p=0.1 IEEC, Barcelona, September 23, 2004
The photospheric 3He abundance* Neutrons 2.22 MeV ne n n n 3He p e- H p 3H • The time evolution of the 2.22 MeV line emission is sensitive to Apho(3He): s{3He(n,p)3H}1.6·104s{1H(n,g)2H} tNRC = 1 / {n(3He)·sNRC·vn} = tRC (H/3He) 6.25·10-5 • Neutron-production time history prompt g-ray line emission (good quality data with SPI) *Not measured by atomic spectroscopy IEEC, Barcelona, September 23, 2004
Chromosphere Photosphere Strong PAS No PAS The magnetic loop model (Hua, Lingenfelter, Murphy, Ramaty...) isotropic accelerated- particle release constant B • MHD turbulence pitch-angle scattering CORONA magnetic mirroring (sin2 B) CHROMOSPHERE PHOTOSPHERE B (pressure)d “loss cone" • No PAS (mean free path ): “fan beam“ of interacting particles (i.e. parallel to the solar surface) • Strong PAS: loss cone continuously repopulated “downward beam“ Hua et al. (2002) IEEC, Barcelona, September 23, 2004
Calculated 2.22 MeV lightcurves • Monte-Carlo code (Hua et al. 1987, 2002) to simulate: (i) the propagation and interaction of the accelerated particles (ii) the neutron production and propagation (iii) the 2.22 MeV line production and absorption • For instantaneous release of the accelerated particles, the 2.22 MeV lightcurves fall faster with increasing PAS (decreasing l) andincreasing 3He/H (see Murphy et al. 2003) IEEC, Barcelona, September 23, 2004
The photospheric 3He abundance: results fan beam downward beam • The two free parameters are stronglycorrelated • l from 4.44 and 6.13 MeV line shapes more accurate 3He/H • Solar neutron measurements (monitors + CORONAS/SONG) could help... IEEC, Barcelona, September 23, 2004
Summary • From g-ray spectroscopy of the 2003 Oct 28 solar flare with SPI: - energy spectrum of the accelerated ions (g-ray line fluences) - accelerated a/p ratio (g-ray line shapes and fluences) - amount of PAS in magnetic loop/angular distribution of the interacting particles (g-ray line shapes and 2.22 MeV lightcurve) acceleration and transport processes - ambient C abundance (g-ray line fluences) - ambient 3He abundance (2.22 MeV lightcurve) solar composition and atmospheric response • Much more to do: - timing analyses using the ACS (and radio data) - analyses of the 2003 Nov 4 flare (near the solar limb !) ... IEEC, Barcelona, September 23, 2004