Download
1 / 14
140 likes | 207 Views
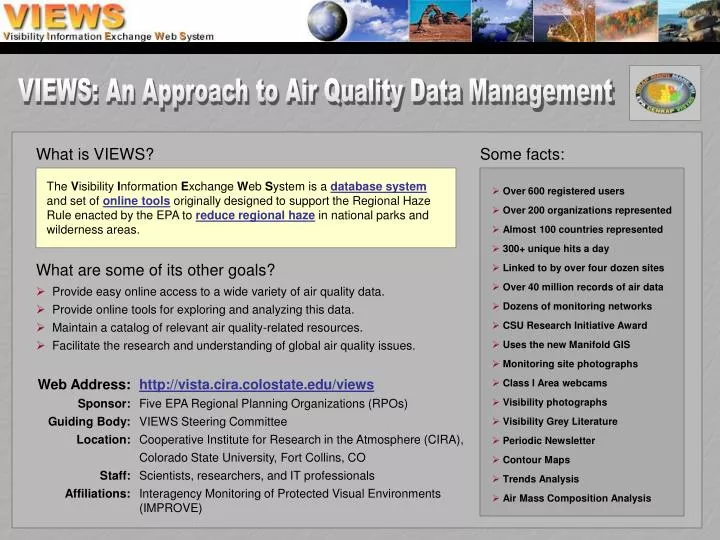
VIEWS: An Approach to Air Quality Data Management. What is VIEWS?. Some facts:.

E N D
VIEWS: An Approach to Air Quality Data Management What is VIEWS? Some facts: The Visibility Information Exchange Web System is a database system and set of online tools originally designed to support the Regional Haze Rule enacted by the EPA to reduce regional haze in national parks and wilderness areas. • Over 600 registered users • Over 200 organizations represented • Almost 100 countries represented • 300+ unique hits a day • Linked to by over four dozen sites • Over 40 million records of air data • Dozens of monitoring networks • CSU Research Initiative Award • Uses the new Manifold GIS • Monitoring site photographs • Class I Area webcams • Visibility photographs • Visibility Grey Literature • Periodic Newsletter • Contour Maps • Trends Analysis • Air Mass Composition Analysis What are some of its other goals? • Provide easy online access to a wide variety of air quality data. • Provide online tools for exploring and analyzing this data. • Maintain a catalog of relevant air quality-related resources. • Facilitate the research and understanding of global air quality issues. Web Address: Sponsor: Guiding Body: Location: Staff: Affiliations: http://vista.cira.colostate.edu/views Five EPA Regional Planning Organizations (RPOs) VIEWS Steering Committee Cooperative Institute for Research in the Atmosphere (CIRA), Colorado State University, Fort Collins, CO Scientists, researchers, and IT professionals Interagency Monitoring of Protected Visual Environments (IMPROVE)
Why NADP? (or, Why Am I Here?): • Because deposition data is an important component of the overall air quality picture. • Because VIEWS is expanding its inventory of deposition data, including NADP data. • Because comparisons between aerosol and deposition data are valuable analysis tools. • To facilitate collaboration and data sharing between U.S., Canadian, and international air quality researchers. • Because important lessons in data modeling and management have been learned from generalizing our originally aerosol-centric system to handle broader categories of air quality data, such as deposition data. Why NADP?
VIEWS Architecture Overview Import Validation Storage Retrieval Presentation Transformation Source Data Database Rules Source Data Analysis Interpretation Program Logic Source Data Front End Back End Import: Getting data into the system Validation: Ensuring data accuracy Storage: Managing data, backup, and archival Transformation: Sorting, joining, aggregating Retrieval: Getting the data out Presentation: Displaying the data Analysis: Making the data understandable Interpretation: Making the data usable VIEWS Architecture Overview
VIEWS Architecture Detail: Data Acquisition & Import • Data Acquisition System: • Accepts submission of data in a variety of schemas and formats • Can automatically extract data from known online sources • Uses database replication where possible • Initially imports data and metadata “as-is” into the source database • Metadata Import System: • Facilitates the entry of new metadata • Validates new metadata entries • Detects overlap with existing metadata • Data Import System: • Extracts data from the source database • Scrubs data and performs conversions • Maps source metadata to integrated metadata • Transforms the data into an integrated schema • Verifies and validates imported data • Loads data into the back-end OLTP system
VIEWS Architecture Detail (cont’d): Data Management • OLTP: • Functions as the “back-end” database • Fully relational and in 3rd normal form • Used for data import, validation, and management • Technologies: Microsoft SQL Server • Data Warehouse Generation System: • Extracts data from the OLTP • De-normalizes and transforms data • Loads data into the Data Warehouse • Builds table indexes • Archives “snapshots” of the database • Technologies: VB, stored procedures • Data Warehouse: • Functions as the “front-end” database • Uses a de-normalized “star schema” • Used for querying and archiving data • Automatically generated from the OLTP • Technologies: Microsoft SQL Server
VIEWS Architecture Detail (cont’d): Data Backup, Restore, and Archival • Backup and Restore System: • Automatically and periodically backs-up critical VIEWS databases • Restores database backups on demand • Replication and Archival System: • Vertically partitions the Data Warehouse by time period • Takes a full “snapshot” of the data warehouse at regular intervals • Creates a historical audit trail for verifying archive integrity
VIEWS Architecture Detail (cont’d): Data Presentation and Analysis
VIEWS Architecture Detail (cont’d): Data Presentation and Analysis
NADP National Trends Network (NTN) Import Detail Data Acquisition System • Used SQL Server DTS Wizard to import NTN sites metadata • Used SQL Server DTS Wizard to import NTN data • Manually entered NTN SOP and method information Metadata Import System • Used SQL scripts to extract unique Sites, Parameters, Methods, and Flags from source data • Created new records in the OLTP for NTN Sites, Parameters, Methods, and Flags using the extracted metadata Data Import System • Transformed the data into the common relational schema • Applied DB integrity constraints • Mapped source codes to relational primary keys (IDs) • Validated the data using a series of row and column checksums and record counts
Simple Comparison Between IMPROVE Aerosol and NADP NTN Data: This simple comparison was performed by “normalizing” the aerosol units (ug/m3) and the deposition units (mg/L) to a common scale and plotting on a single graph.
Comparisons: Air Concentration and Deposition Data • Wet Deposition (NADP/NTN) • Aqueous rain water concentration (mg/L). • Precipitation weighted mean concentration (mg/L). • Deposition (kg/ha) - the product of aqueous SO42- concentration in collected rain water and total precipitation over a given time period (e.g. season, year). • Dry Deposition (CASTNet) • Dry deposition (kg/ha) for atmospheric particles and gas phase species (e.g. SO2, HNO3, NH3) - the product of the species’ deposition velocity and the ambient air concentration integrated over time (e.g. season, year). • Air Concentrations (IMPROVE, CASTNet, STN, other speciated networks) • Aerosol and gas phase air concentrations (ug/m3). • Inter-comparisons (Sulfur) • Compare raw concentration data (ug/m3 to mg/L) • Compare slopes in respective trends, for example S (SO2 plus SO42-) air concentrations to S deposition expressed as %/season, %/yr. Aerosol and Deposition Comparisons
Conclusion... Data Status • NADP AIRMoN and NTN data has been imported into the VIEWS database. • AIRMoN data is currently available from the VIEWS website. • NTN data will be available when we’ve completed a full description of the NTN metadata mappings for inclusion with downloaded data. Next Steps • Explore the issues involved in comparing deposition and aerosol data. • Investigate new and better methods for comparing the two types of data. • Provide automatic tools and/or case studies for viewing the comparisons. • Foster communication and collaboration within the air quality community. • Facilitate research by sharing data, technologies, and experiences.
Thank You! http://vista.cira.colostate.edu/views Author: Shawn McClure mcclure@cira.colostate.edu