Download
1 / 24
280 likes | 505 Views
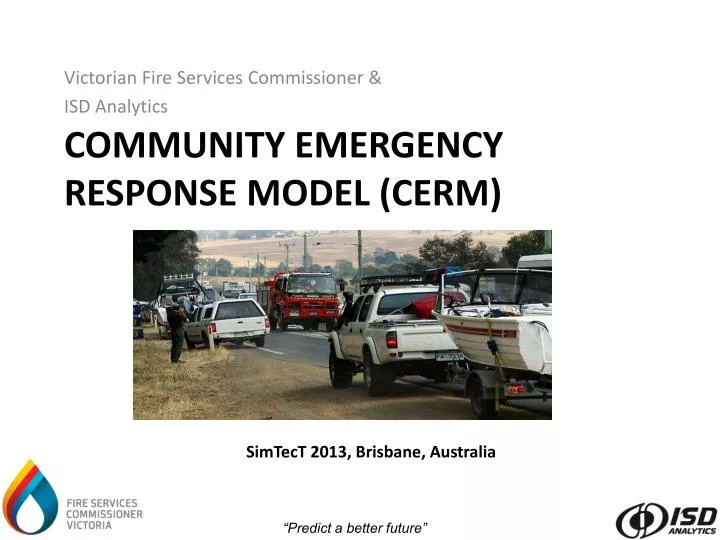
Victorian Fire Services Commissioner & ISD Analytics. Community emergency response model (CERM). SimTecT 2013, Brisbane, Australia. Simulait Online.

E N D
Victorian Fire Services Commissioner & ISD Analytics Community emergency response model (CERM) SimTecT 2013, Brisbane, Australia
Simulait Online • Simulait Online is like a real life “SimCity” application where businesses or Government can accurately predict and test strategies to influence the behavior of populations • Simulait Online uses a broad range of data sources to explain: • What will consumers/communities do in the future? • How can I change or influence what consumers/communities will do? • What is the impact on my organisation or the community? • What is the impact of different or new scenarios, strategies, policies, trends, marketing campaigns, products, prices, competitive gaming, or future disruptive events? • Simulation-based Big Data Predictive Analytics approach: • Applied to diverse consumer domains: water, energy, emergency response, retail, transport, ... • Applied globally: Australia, Europe, USA • Cloud solution: on-demand access with a web browser
The Challenge Following the 2009 bushfires that claimed 173 lives, the Victorian Royal Commission concluded that: "a more comprehensive policy is required-one that better accommodates the diversity of bushfires and human responses". 2009 Victorian Bushfires Royal Commission
Complex Problem • Need to predict community behaviour given: • The diverse and dynamic differences both within and between communities • E.g. demographic profile, level of preparedness & intentions • Degree of motivation to act and types of behaviours • E.g. response to warnings & communication, safety messages and visual cues • The uniqueness of each bushfire event • The implementation of new untested strategies or interventions • E.g. warnings communicated – when, what and how • Engagement with, and attitude towards, bushfire education and preparedness • Sufficient data exists to simulate and predict community behaviour.... just need the right tools to manage the complexity and bring it all together!
The Solution: CERM • Community Emergency Response Model (CERM) can accurately predict the behavioural responses of communities to bushfires • What people will do and when: Stay, Leave or “Wait and see” (undecided) • Where people will go: Neighbours, Designated shelter, Leave region or Open area • Community responses to communications and bushfire warnings • Warning type /content, mediums, schedule, intensity • Response to the arrival of the fire & its severity/size
Comprehensive Evidence-Based Model • CERM was developed in partnership with a team of emergency services professionals and researchers, using extensive emergence response and health research on community response and behaviour • Can account for a broad range of factors influencing people’s response to emergencies • Census and socio-demographic data • Different levels of threat • Fire spread and severity • Household profile: e.g. preparedness, intentions, etc.. • Warning schedules: mediums, timing, intensity • The presence of emergency services • Resource failures – e.g. water and power
Accurate, Functional, Accessible • Benefits of CERM include accuracy, functionality and accessibility • CERM was applied to two fires in Victoria (Churchill, 2009) and South Australia (Wangary, 2005) and demonstrated over 90% accuracy • Accuracy is not the only important aspect of CERM... it is the scenarios you can test and the insights you can gain • Simulait Online: on-demand access to CERM using a web-browser
Inform Decisions, Save Lives • Better predictions of community behaviour, and testing of interventions that can influence their behaviour, can support community risk assessment, safety planning, and enable realistic and effective policies • Application examples: • Shelter options • Warnings and community advice • Traffic management • Community risk assessment and protection • Strategies, policies and interventions to minimise community risk • CERM is applicable to other emergencies/disasters, as well as health policy • Based on a human cognitive risk model when life is under threat
Wangary Insights • Warnings impacted on the community’s ability to respond appropriately • Some people were caught unaware on fire impact, and thus were unprepared • Lack of warnings and communication regarding the fire progression and impact • High speed of the fire • Some people that intended to stay changed their decision at the last moment • Warnings and communications underestimated the severity of the fire • Fire was more severe than people anticipated based on warnings • Resulted in people leaving at the worst/unsafe time - when the fire arrived
Churchill Insights • Emergency Services Effect: identified unexpected factors that resulted in communities in different localities to respond differently • Presence of emergency services reduced the perceived threat by the community, resulting in most not making a decision to leave or stay • The wind then changed and the community were unprepared on fire impact • Late response limited the refuge options for those that decide to leave
Planning for High Risk Communities • Applied the model to high risk communities to support safety planning • Focus was on how many people would leave and when for a small and large fire, to assist with traffic modelling and risk assessment • Compared community response to a high severity (FFDI 50) and a catastrophic fire (FFDI 130) • Looked at the response of different communities that were impacted at different times by the fire and warnings
Comparison: Community A Catastrophic Fire (FFDI 130) High Severity Fire (FFDI 50) Emergency Warnings Embers, fire impact Smoke visible, Watch & Act alerts Smoke visible, Watch & Act alerts Impact & Emergency Warnings
Response timeline: Community A Impact Scenario • ‘Code red’ fire (FFDI 130) • Up to 9 h warning prior to impact • Predictions @ 30 min intervals Predicted response • 60% of residents left in 2 ‘waves’ Observations • 20% in 1st wave ‘early responders’ (most vulnerable) • 40% in 2nd wave (less vulnerable) Smoke, Watch & Act D E Emergency Warnings B C A
Place of refuge: Community A Predicted place of refuge Early responders • Outside the region • Designated shelters 2nd wave also went • Neighbours • Open areas (i.e. ‘last-minute’ refuges) Causal factors Why did 4% of residents seek refuge in open areas? • Too vulnerable to defend against a code red fire, • No vehicle, and • No neighbours that remained at home Watch & Act alerts Emergency Warnings
Comparison: Community B Catastrophic Fire (FFDI 130) High Severity Fire (FFDI 50) Embers & fire impact Smoke visible, Emergency Warnings Smoke visible, Emergency Warnings Embers, fire impact
Response timeline: Community B Scenario • ‘Code red’ fire (FFDI 130) • Only up to 1 h warning prior to impact • Predictions @ 30 min intervals Predicted response • 53% of residents left Observations • At impact, only 3% had left... • ...and 31% were still preparing to leave Impact C Smoke, Emergency Warnings B A
Place of refuge: Community B Predicted place of refuge Ultimately: • Outside the region (19%) • Open areas (12%) • Neighbours (11%) • Designated shelters (8%) Observations • A relatively high proportion went to open areas and neighbours (‘last-minute’ refuges) • Consistent with having limited time to prepare Impact Emergency Warnings
Run Simulations Run simulation Select simulation time period Select geographical regions to simulate
Download Results Download results
Results • Results are available in different formats, and you can drill down by geographical region, time frame, response type, etc...
Questions? ISDAnalytics 27 Chesser Street, Adelaide, South Australia, 5000 Phone: +61 8 7200 3589 info@isdanalytics.com www. isdanalytics.com