Download

1 / 59
610 likes | 811 Views
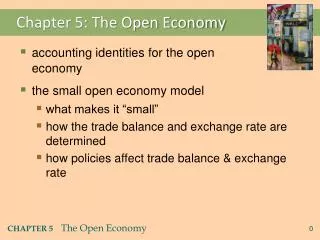
CHAPTER FIVE The Open Economy. Chapter objectives. accounting identities for the open economy small open economy model what makes it “small” how the trade balance and exchange rate are determined how policies affect trade balance & exchange rate.

E N D
CHAPTER FIVE The Open Economy
Chapter objectives • accounting identities for the open economy • small open economy model • what makes it “small” • how the trade balance and exchange rate are determined • how policies affect trade balance & exchange rate
Imports and Exports as a percentage of output: 2003 source: OECD
In an open economy, • spending need not equal output • saving need not equal investment
Preliminaries EX = exports = foreign spending on domestic goods IM = imports = C f+ I f+ G f= spending on foreign goods NX = net exports (a.k.a. the “trade balance”) = EX – IM superscripts: d = spending on domestic goods f = spending on foreign goods
net exports domestic spending output The national income identity in an open economy Y = C + I + G + NX or, NX= Y– (C+ I + G)
Trade surpluses and deficits • trade surplus: output > spending and exports > imports Size of the trade surplus = NX • trade deficit: spending > output and imports > exports Size of the trade deficit = –NX NX = EX – IM = Y– (C+ I + G )
International capital flows • Net capital outflows • S – I • net outflow of “loanable funds” • net purchases of foreign assetsthe country’s purchases of foreign assets minus foreign purchases of domestic assets • When S > I, country is a net lender • When S < I, country is a net borrower
The link between trade & cap. flows NX= Y– (C+ I+ G ) implies NX = (Y– C– G ) – I = S – I trade balance = net capital outflows Thus, a country with a trade deficit (NX < 0) is a net borrower (S < I ).
The world’s largest debtor nation • U.S. has had large trade deficits, been a net borrower each year since the early 1980s. • As of 12/31/2003: • U.S. residents owned $7.9 trillion worth of foreign assets • Foreigners owned $10.5 trillion worth of U.S. assets • U.S. net indebtedness to rest of the world:$2.6 trillion---higher than any other country, hence U.S. is “world’s largest debtor nation”
Saving and Investment in a Small Open Economy • An open-economy version of the loanable funds model from chapter 3. • Includes many of the same elements:
r S, I National Saving: The Supply of Loanable Funds As in Chapter 3,national saving does not depend on the interest rate
Assumptions re: capital flows • domestic & foreign bonds are perfect substitutes (same risk, maturity, etc.) • perfect capital mobility:no restrictions on international trade in assets • economy is small:cannot affect the world interest rate, denoted r* a & b imply r = r* c implies r*is exogenous
r I(r) S, I Investment: The Demand for Loanable Funds Investment is still a downward-sloping function of the interest rate, but the exogenous world interest rate… r* …determines the country’s level of investment. I(r*)
r rc I(r) S, I If the economy were closed… …the interest rate would adjust to equate investment and saving:
r r* rc I(r) S, I I1 But in a small open economy… the exogenous world interest rate determines investment… NX …and the difference between saving and investment determines net capital outflows and net exports
Three experiments 1. Fiscal policy at home 2. Fiscal policy abroad 3. An increase in investment demand
r NX2 NX1 Results: I(r) S, I I1 1. Fiscal policy at home An increase in G or decrease in T reduces saving.
Budget deficit(right scale) Net exports(left scale) NX and the Government Budget Deficit
r NX2 NX1 I(r) S, I 2. Fiscal policy abroad Expansionary fiscal policy abroad raises the world interest rate. Results:
r S NX1 I(r)1 S, I I1 3. An increase in investment demand EXERCISE: Use the model to determine the impact of an increase in investment demand on NX, S, I, and net capital outflow.
r S NX2 NX1 I(r)2 I(r)1 S, I I2 I1 3. An increase in investment demand ANSWERS: I > 0, S = 0, net capital outflows and net exports fall by the amount I
The nominal exchange rate e = nominal exchange rate, the relative price of domestic currency in terms of foreign currency (e.g. Yen per Dollar)
the lowercase Greek letter epsilon The real exchange rate = real exchange rate, the relative price of domestic goods in terms of foreign goods (e.g. Japanese Big Macs per U.S. Big Mac) ε
ε ~ McZample ~ • one good: Big Mac • price in Japan: P* = 200 Yen • price in USA: P = $2.50 • nominal exchange rate e = 120 Yen/$ To buy a U.S. Big Mac, someone from Japan would have to pay an amount that could buy 1.5 Japanese Big Macs.
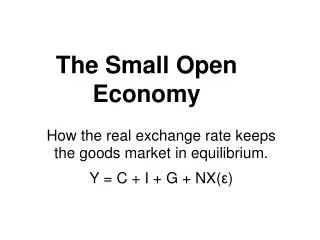
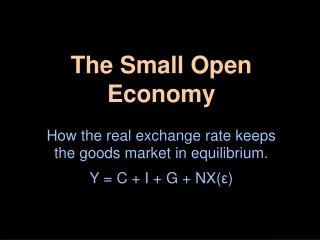
ε in the real world & our model • In the real world:We can think of ε as the relative price of a basket of domestic goods in terms of a basket of foreign goods • In our macro model:There’s just one good, “output.”So ε is the relative price of one country’s output in terms of the other country’s output
How NXdepends on ε εU.S. goods become more expensive relative to foreign goods EX, IM NX
The net exports function • The net exports function reflects this inverse relationship between NX and ε: NX = NX(ε)
ε so U.S. net exports will be high When ε is relatively low, U.S. goods are relatively inexpensive ε1 NX(ε) 0 NX NX(ε1) The NX curve for the U.S.
ε At high enough values ofε, U.S. goods become so expensive that ε2 we export less than we import NX(ε) 0 NX NX(ε2) The NX curve for the U.S.
How ε is determined • The accounting identity says NX = S-I • We saw earlier how S-I is determined: • S depends on domestic factors (output, fiscal policy variables, etc) • I is determined by the world interest rate r* • So, ε must adjust to ensure
ε NX(ε) NX How ε is determined Neither Snor I depend on ε, so the net capital outflow curve is vertical. ε1 ε adjusts to equate NXwith net capital outflow, S-I. NX1
ε NX(ε) NX Interpretation: supply and demand in the foreign exchange market demand: Foreigners need dollars to buy U.S. net exports. supply: The net capital outflow (S-I) is the supply of dollars to be invested abroad. ε1 NX1
Four experiments 1. Fiscal policy at home 2. Fiscal policy abroad 3. An increase in investment demand 4. Trade policy to restrict imports
ε ε2 ε1 NX(ε) NX NX1 NX2 1. Fiscal policy at home A fiscal expansion reduces national saving, net capital outflows, and the supply of dollars in the foreign exchange market… …causing the real exchange rate to rise and NX to fall.
ε ε1 ε2 NX(ε) NX NX2 NX1 2. Fiscal policy abroad An increase in r* reduces investment, increasing net capital outflows and the supply of dollars in the foreign exchange market… …causing the real exchange rate to fall and NX to rise.
ε ε2 ε1 NX(ε) NX NX1 NX2 3. An increase in investment demand An increase in investment reduces net capital outflows and the supply of dollars in the foreign exchange market… …causing the real exchange rate to rise and NX to fall.
ε ε2 ε1 NX(ε)2 NX(ε)1 NX NX1 4. Trade policy to restrict imports At any given value of ε, an import quota IM NX demand for dollars shifts right Trade policy doesn’t affect S or I , so capital flows and the supply of dollars remains fixed.
ε ε2 ε1 NX(ε)2 NX(ε)1 NX NX1 4. Trade policy to restrict imports Results: ε > 0 (demand increase) NX = 0(supply fixed) IM < 0 (policy) EX < 0(rise in ε )
The Determinants of the Nominal Exchange Rate • Start with the expression for the real exchange rate: • Solve it for the nominal exchange rate:
The Determinants of the Nominal Exchange Rate • So e depends on the real exchange rate and the price levels at home and abroad… • …and we know how each of them is determined:
The Determinants of the Nominal Exchange Rate • We can rewrite this equation in terms of growth rates (see “arithmetic tricks for working with percentage changes,” Chap 2 ): • For a given value of ε, the growth rate of e equals the difference between foreign and domestic inflation rates.
Inflation and nominal exchange rates Percentage 10 change 9 in nominal 8 exchange South Africa rate 7 6 Depreciation relative to Italy 5 U.S. dollar 4 New Zealand Australia Spain 3 Sweden Ireland 2 Canada 1 UK France Belgium 0 - 1 Appreciation Germany Netherlands relative to - 2 U.S. dollar Switzerland - 3 Japan - 4 - 3 - 2 - 1 0 1 2 3 4 5 6 7 8 Inflation differential
Purchasing Power Parity (PPP) Two definitions: • a doctrine that states that goods must sell at the same (currency-adjusted) price in all countries. • the nominal exchange rate adjusts to equalize the cost of a basket of goods across countries. Reasoning: • arbitrage, the law of one price
Cost of a basket of foreign goods, in foreign currency. Cost of a basket of domestic goods, in foreign currency. Cost of a basket of domestic goods, in domestic currency. Purchasing Power Parity (PPP) • PPP: e P = P* • Solve for e: e = P*/P • PPP implies that the nominal exchange rate between two countries equals the ratio of the countries’ price levels.