Download
1 / 23
270 likes | 682 Views
Risk Stratification. Peter Flynn Director of Performance & Information. Agenda. Kirklees What is Risk Stratification? How does it work? Business Case for NHS Kirklees Progress to date Next Steps. Key Statistics . Population of over 400,000 433,000+ by 2018

E N D
Risk Stratification Peter Flynn Director of Performance & Information
Agenda • Kirklees • What is Risk Stratification? • How does it work? • Business Case for NHS Kirklees • Progress to date • Next Steps
Key Statistics • Population of over 400,000 • 433,000+ by 2018 • Covers urban areas of Huddersfield, Dewsbury, Batley,Cleckheaton, Liversedge,Heckmondwike and Mirfield • Rural areas in Colne and HolmeValleys • 72 GP Practices • 23 Local Authority wards • 8 of these fall into the 25% most deprived in England and Wales
Health Need Assessment Joint Strategic Needs Assessment refreshed 09/10 CLIK and Young People’s survey Issues: • Smoking – Obesity • Alcohol – Physical activity Priorities: • LTC – WOCBA • Emotional health and well-being
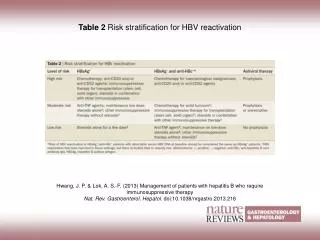
Risk Stratification 101 • Risk Stratification is a tool to assist in the identification of people who are at most risk of (re)admission to hospital. • History in the NHS • 2005 DH competitive tender to identify patients at high risk of admission to hospital • Tender won by King’s Fund, New York University and Health Dialog • First tools piloted in UK in 2006/7. Algorithm made available to the NHS.
…continued • Products were PARR family of tools (PARR = Patients At Risk of Readmission) (PARR PARR+ PARR++ downloadable from King’s Fund Web site www.kingsfund.org.uk ) • Clue in the name • Patients • Readmission Risk assessed approx 5% of a population who had already had a recent emergency admission
Single Data Source Inpatient data PARR
How it works Look back 3 years & identify factors that contributed to admissions Regression Analysis Predict Risk for next year
Combined Predictive Model • 2nd Generation algorithm • Risk assesses an entire population • Uses additional sources of data:-
Multiple Data Sources A&E data GP Practice data Inpatient data Social Services data Outpatient data PARR Combined Model
Business Case • Unplanned Admissions rising • Hospital re-configuration – Mid Yorks • Need to reduce unplanned admissions by 16% (over 3 years) via whole system LTC service redesign. The predictive risk tool is integral to this whole system redesign
Evidence that it works? • Various studies, including Croydon • 6 months data • Predicted next 6 months using PARR+ and CPM • Waited 6 months to see what actually happened • Compared Prediction vs Actual • PARR+ approx 60% accurate (and only subset of patients) • CPM approx 85% accurate (and whole population)
Chronic Care Systems • Characteristics of High Performing Chronic Care Systems 1: • Universal coverage • Care free at the point of use • Delivery system should focus on prevention of ill health not just treatment of sickness • Priority should be given to patients to self manage their conditions with support from carers and families • Priority is given to primary health care • Population management is emphasised through the use of risk stratification tools and care planning • Care should be integrated – primary, community, social care, secondary care • Exploit the potential benefits of information technology in improving chronic disease • Care should be properly coordinated especially in those with multiple conditions including patient activation • Link the above 9 characteristics into a coherent whole to achieve cumulative impact 1 Chris Ham. The ten characteristics of the high-performing chronic care system. Health Economics, Policy and Law, 2010; 5(01); 1-20
Process so Far Tendering process Feb 2009 Successful company Bupa Health Dialog18 month contract Contract start Sept 2009 Wave 1 delivery April 2010 29 Practices Wave 2 delivery June 2010 68 Practices Project review Sept 2010
What have we bought? • Access to IP to make Risk modelling work • Resources to deliver the project • Use of extract routines • HES/SUS • Apollo/MIQUEST • Integrated Care Manager (ICM) • By Practice • PCT • Refreshed quarterly then monthly to Mar 2011
Critical Success Factors • Formal Project led by LTC Programme Board. N.B. not an IM&T project • Clinical Engagement (68/72 practices) & Clinical Leadership • Dedicated PCT project management and practice support (2 wte) • Data sharing agreement inc. Pseudonymisation • GP Incentive Scheme • Consent • Training – GP and Practice Manager • Validate 0-0.5% of practice population. (Should be known) • 7 x monthly MDT meetings focused on 0.5-5% of practice population
Challenges • Clinical Engagement – Key Lead (left area) • Significant time investment with GPs and Practices to get involved • Technical issues with MIQUEST queries & TPP • Time consuming for Data Quality Team – dedicated resource 1 WTE – extraction & loading of software. Needed more • Embedding use of the tool into normal practice
Technical processes • Pseudonymisation Software • HES/SUS extracts for Acute data • Apollo remote extraction for EMIS LV and Synergy practices • MIQUEST for TPP and EMIS PCS practices • Microsoft Access “front end” • Microsoft Excel output (Practice ICM)
What next… • ICM delivered monthly September 2010 to March 2011 • Training offered to Practices until August 2010 • Development of focus groups • Clinical Engagement Group • Benefits Realisation Group • Infrastructure Group • Ongoing support (“drop in”, newsletter etc..)
Next Steps: Critical Success Factors • Using the information effectively, i.e. clinical engagement and MDT meetings “Population management is emphasised through the use of risk stratification tools and care planning” • We believe that we will succeed!
Summary • Risk Stratification tools are shown to work • Combined Predictive Model the most advanced • Significant savings and quality improvements around LTC need to made in Kirklees • Our future Acute activity is predicated on achieving these savings • Excellent progress so far – Clinical engagement
More Info King’s Fund Report on Combined Predictive Model http://www.kingsfund.org.uk/document.rm?id=6744 King’s Fund page of Predicting and Reducing Re-admission: http://www.kingsfund.org.uk/current_projects/predicting_and_reducing_readmission_to_hospital/resources.html