Download
1 / 16
160 likes | 360 Views
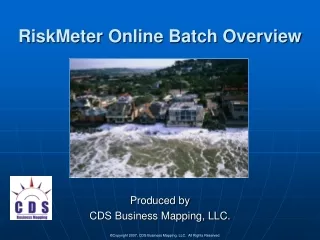
RiskMeter Storm Surge Overview. Produced by CDS Business Mapping, LLC. . © Copyright 2007, CDS Business Mapping, LLC. All Rights Reserved. Introduction. Insurance companies, particularly commercial insurers, are concerned with coastal flooding

E N D
RiskMeter Storm Surge Overview Produced by CDS Business Mapping, LLC. ©Copyright 2007, CDS Business Mapping, LLC. All Rights Reserved.
Introduction • Insurance companies, particularly commercial insurers, are concerned with coastal flooding • Hurricane Katrina was more of a flood event than a wind event • Recent court rulings have held insurers liable for hurricane flooding even if not technically covered
About CDS Storm Surge Model Model is based upon two different sources • SLOSH Model • Most well known storm surge model • State Storm Surge Contours • States have done work to map actual areas inundated by storm surge
What is SLOSH Data? • Slosh predicts storm surge levels based upon different hurricane categories • The data we used predicts storm surge heights at high tide • worst case scenario • The heights shown are the surge heights above sea-level, not above the ground
Texas SLOSH Basins Overlapping basins
Slosh Basins-Long Island The label show surge heights for Cat 1, 2, 3, 4 The gray cells have no surge values There are cells which clearly would experi-ence storm surge, that have no values Eastern end of Long Island, NY
Surge Contours • The problem isn’t as simple as it seems • In this illustration, you can see that a location may be inland, but protected by a hill; but if the water is high enough, it may go over the hill (or levee – think Katrina) • Just because SLOSH says the water is above the elevation of the location, this does NOT mean that the property would be inundated; topology matters
Surge Contours – Long Island Eastern end of Long Island, NY
What we’ve developed • We’ve combined the storm surge contours and SLOSH data • We’ve filled in the missing SLOSH cells • We give you the highest values from multiple basins (users do not have to select a basin) • If you combine this with the RiskMeter slope/aspect/elevation report, you can estimate the water depth at any location! • This gives the most complete picture of storm surge effects in an area available today, from anyone
Fields Returned • Minimum Hurricane Category • Surge Height Category 1 • Surge Height Category 2 • Surge Height Category 3 • Surge Height Category 4 • Surge Height Category 5 • Notes
Considerations • You will notice, in some cases, there are missing slosh values; we’ve developed a method to fill in these areas • For the elevation contours, states may have used a different elevation dataset; this may cause minor inconsistencies • Some states are missing; we are building our own data • missing states: MD, VA and Western LA • From MD north, no Category 5 data exists • CT has modeled Category 1 & 2 together • Parts of FL have only modeled Category 1, 3 & 5
How Big is the Problem? NY/Long Island Example
How Big is the Problem? • New York/Long Island • Population living in a 100 year flood zone: 2,482,038 • Population living in a storm surge area: 4,746,434 • Population living in a storm surge area and • not recognized as a 100 year flood zone: 2,936,639 • Population based upon storm category: • Category 1: 238,355 • Category 2: 524,434 • Category 3: 962,823 • Category 4: 1,211,027
How Big is the Problem? As you can see, in TX, storm surge extends tens of miles inland!
Conclusions • Flood zones do not accurately identify storm surge risks • By using the Storm Surge Model in conjunction with Elevation/Slope and Distance to Coast reports, you can estimate any property’s vulnerability to hurricane surge effects, even inland • You can set limits for policies based on this new information • i.e. For properties within 2 miles from the coast, you will not write properties in zone 1, 2 or 3 • Surcharge policies that fall within storm surge areas • The CDS Storm Surge Model is the best and most comprehensive model available to predict possible storm surge effects / flooding from hurricanes
Contact Information If you have any questions, please contact: Dan Munson Vice President of Sales & Marketing 617-737-4444 dmunson@cdsys.com