Download
1 / 15
290 likes | 1.65k Views
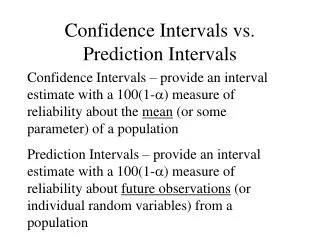
Confidence Intervals vs. Prediction Intervals. Confidence Intervals – provide an interval estimate with a 100(1- ) measure of reliability about the mean (or some parameter) of a population

E N D
Confidence Intervals vs. Prediction Intervals Confidence Intervals – provide an interval estimate with a 100(1-) measure of reliability about the mean (or some parameter) of a population Prediction Intervals – provide an interval estimate with a 100(1-) measure of reliability about future observations (or individual random variables) from a population
Inference on the Mean Response Let x* be some specified value of the predictor variable x The mean response at x* is Hence, the point estimate of the mean at x* is
Inference on the Mean Response Cont’d Aside: The estimated mean is on the least squares line Mean and Variance of
C.I. for the Mean Response at x* A 100(1-)% confidence interval for is given by Recall:
Remarks about C.I.’s at x* • The best estimation (i.e. tightest C.I.’s) of occurs at since the variance increases as x* moves away from • The estimation of the mean response should only be used for x values within the range of the data (i.e., x*’s within the range of the x’s of the data). Extrapolation in very dangerous and should be used with extreme caution.
Multiple C.I.’s Consider a collection of k different 100(1-)% C.I.’s correspond the k different specifications of x*. The joint confidence level for this collection of confidence intervals is bounded below by Bonferroni’s inequality; as such the confidence level is guaranteed to no less than 100(1-k)%.
Example – Multiple C.I.’s Consider the data of problem 12.4. Suppose we wish to construct 95% confidence intervals for the mean response when x* = 4, 10, 18. The joint confidence level for these 3 intervals is guaranteed to be at least 100(1-3(.05))% = 85%.
Prediction Intervals • Frequently, we would like to use our L.S. regression model to predict the response y when x = x* • Our best guess would be the mean response at x*, i.e.
Prediction Intervals Cont’d • Computing the variance of this guess (or prediction) yields
Prediction Interval Cont’d Hence, the 100(1- )% Prediction Interval for Y when x = x* is
Remarks about P.I.’s at x* • The P.I.’s are wider than C.I.’s. • As with C.I.’s the prediction interval is tightest at x = x* and as a rule, should not be used for extrapolated x* specifications • Additionally, as with C.I.’s, the joint confidence level of Multiple P.I.’s is bounded by Bonferroni’s inequality
Example 12.4 Cont’d For the data of example 12.4, calculate the confidence interval and prediction interval corresponding to x* = 30
Scatter Plot with Confidence Intervals and Prediction Intervals