Download
1 / 17
170 likes | 308 Views
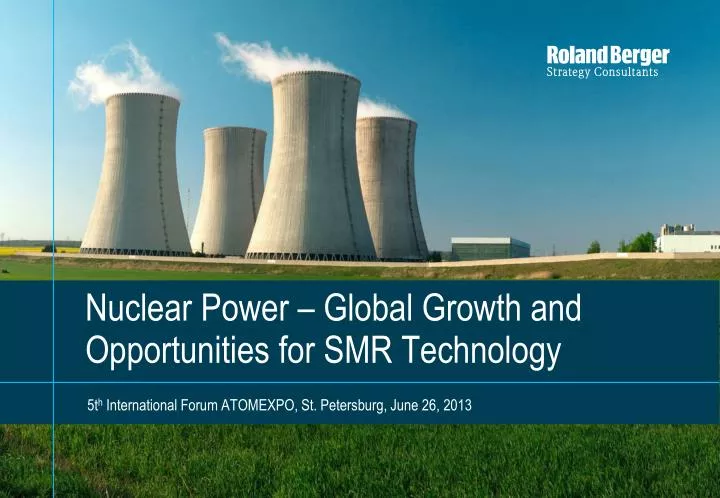
Nuclear Power – Global Growth and Opportunities for SMR Technology. 5t h International Forum ATOMEXPO , St. Petersburg, June 26, 2013. Worldwide nuclear capacity is concentrated in 4 locations: US, France / Europe, Japan, and Russia. World mapping of nuclear installed base – May 2013.

E N D
Nuclear Power – Global Growth and Opportunities for SMR Technology • 5th International Forum ATOMEXPO, St. Petersburg, June 26, 2013
Worldwide nuclear capacity is concentrated in 4 locations: US, France / Europe, Japan, and Russia World mapping of nuclear installed base – May 2013 KEY FIGURES • 384 operating reactors in 30 countries if excluding Japan (vs 444 reactors in 30 countries before the Fukushima disaster) • 322 GWenet capacity if excluding Japan (vs 373 pre-Fukushima ) • 58% of reactors located in the USA and Western Europe • Nuclear reactors in Japan still idled as of now (last operating one put in maintenance early May 2012) Nuclear Plants Nuclear Countries Source: IAEA, WNA, Roland Berger analysis
More than 80 per cent of installed nuclear capacity is concentrated in 10 countries Country breakdown of installed base – May 2012 view [# units ; MWe net] United States 104(98,658) France 58(63,110) • Japan • 37(32,970) Russian Federation 33(23,917) Korea RO (South) 23(19,921) MAJORNUCLEAR COUNTRIES • China (incl.Taiwan) • 21(16,671) • India • 20(4,281) • Canada • 18(12,569) United Kingdom 16(10,058) ∑ = 421 reactors 355 GWe • Ukraine • 15(13,168) • Sweden • 10(9,101) • Germany • 9(12,008) Spain 8(7,442) Belgium 7(5,755) Czech Republic 6(3,707) Switzerland 5(3,220) Slovak Republic 4(1,656) Finland 4(2,676) ∑ = 384 reactors 322 GWe (if excl. Japan) Hungary 4(1,889) Pakistan 3(725) Mexico 2(1,600) SMALLNUCLEAR COUNTRIES Romania 2(1,305) South Africa 2(1,842) Brazil 2(1,896) Bulgaria 2(1,906) Argentina 2(935) Armenia 1(376) Slovenia 1(676) Netherlands 1(452) • Iran • 1(915) Source: IAEA, WNA, Roland Berger analysis
Since Fukushima, the operating nuclear base has decreased by 5% - restarts of idled reactors in Japan is on Abe´s political agenda Number and capacity of nuclear reactors worldwide KEY DEVELOPMENTS • Including Japanese reactors damaged by the tsunami or shutdown on a long term basis by government request, we observe a net substraction of 24 GW (29 reactors) to the operating base • Shutdowns are concentrated in Japan (14.6 GW, 18 reactors), Germany (8.3 GW, 8 reactors) and the UK (0.9 GW, 3 reactors) • Additions are in China (1.6 GW, 2 reactors), Iran (0.9 GW, 1 reactor), Russia (0.5 GW, 1 reactor) and South Korea (1.9 GW, 2 reactors) • Operating reactors pre Fukushima • Shutdowns / long term suspensions • Commissionning • Operating reactors in May 2012 • 373GW • 24GW • 5GW • 355GW • Operating reactors pre Fukushima • Shutdowns / long term suspensions • Commissionning • Operating reactors in May 2012 # reactors GWe Source: WNA, WNN, IAEA, Roland Berger analysis
Overall, the Fukushima impact will remain small on installed base, but more significant on new build– over 60% delays in "low" scenario Impact on INSTALLED BASE Impact on NEW BUILD [# reactors] [# reactors] 310 310 444 444 444 310 10 10 Early shutdown Cancelled 9 1 Life span extension not granted Frozen over 2030 143 Announced or planned Delayed > 5 years 248 142 414(93%) 349(79%) No impact Delayed > 2 years 145(47%) Under construction 57(18%) No impact Operating in 2010 High Low 2010 projects High Low Typical life span: 40 years. Typical extension: 20 additional years Source: Roland Berger nuclear database
The Nuclear market is still expanding. 60 GW under construction worldwide, thereof 75% in BRIC countries Country breakdown of the NPP under construction – May 2012 [# units ; MWe net] COMMENTS • Most of NPPs under construction are located in Asia and Eastern Europe • China (mainland and Taiwan) is the main country for reactors under construction • Significant activity in Russia, South Korea and India • Very few projects in developed countries • All NPP under construction should be in operation by 2020 • China (incl. Taiwan) • 28 (29,234) Russian Federation 10 (8,714) • India 7 (5,074) Korea RO (South) 4 (5,050) United States 3 (3,565) Ukraine 2(1,900) • Slovak Republic • 2 (840) ∑ = 62 reactors 60 GWe • Pakistan • 2 (630) • France • 1 (1,650) • Finland • 1 (1,600) • Brazil • 1(1,245) • Iran • 1 (915) • Argentina • 1 (692) Source: IAEA, WNA, Roland Berger analysis
China is expected to rely strongly on nuclear energy in the future – 40 reactors in construction atthe end of 2012 Scenario considered for Greater China CHANGES IN GREATER CHINA INSTALLED CAPACITY [# reactors] OVERVIEW ON GREATER CHINA CURRENT STATUS • Recent development • Stress tests following Fukushima: small impact on projects under construction, delay on planned reactors • Taiwan announced a progressive phase out • 2 new reactors completed in mainland since Fukushima, adding 1650 MWe to the total capacity LOW Under construction Operating • 97 • 97 • 96 • 96 • 95 • 95 • 94 • 94 • 93 • 93 • 93 • 93 • 93 • 93 • 93 • 93 • 100 • 88 822) 80 611) 60 40 20 0 • Roland Berger scenarios • Reactors under construction: delay assumed vsWNA expected date of completion (2 years in low scenario, 1 year in high scenario) • Reactors planned or announced: new estimated starting date for construction (based on WNA if available, RB estimates otherwise) + 6 years estimated to complete construction + delay due to potential post-Fukushima potential measures (2 years in low scenario, 1 year in high scenario) 2012 13 14 15 16 17 18 19 20 21 22 23 24 25 26 27 28 29 2030 HIGH • 99 • 99 • 99 • 99 • 99 • 99 • 99 • 99 • 99 • 99 • 99 • 99 • 99 • 99 • 99 • 98 • 90 • 100 84 80 611) 60 40 20 0 2012 13 14 15 16 17 18 19 20 21 22 23 24 25 26 27 28 29 2030 1)28 reactors already in construction in May, 12 more started by the end of 2012. 21 reactors operating 2) 2 reactors under construction in Taiwan expected to be cancelled in RB low scenario Source: WNA, press releases, Roland Berger nuclear database
Russia is systematically pursuing its nuclear agenda with a dual focus on domestic and export markets Scenario considered for the Russia OVERVIEW ON RUSSIA CURRENT STATUS CHANGES IN RUSSIA INSTALLED CAPACITY [# reactors] • Recent development • Following Fukushima, authorities announced their intention to improve security – back-up power and water supply as main concerns – and to extend the life of the existing reactors • Kalinin 4 is operating since November 2011 • Russia is strongly pushing exports in nuclear energy, with plans in 7 countries at least1) LOW Under construction Operating • 100 • 83 • 83 • 83 • 83 • 74 • 80 • 65 • 63 • 61 • 60 • 59 • 59 • 60 51 • 51 • 51 50 50 46 45 43 • 40 • 20 0 2012 13 14 15 16 17 18 19 20 21 22 23 24 25 26 27 28 29 2030 HIGH • Roland Berger scenarios • No delays for reactors under construction • 2 years delays in low scenario for "planned" or "announced" reactors • 100 85 85 85 83 74 • 80 65 63 61 60 59 59 51 51 51 • 60 50 50 46 45 43 • 40 • 20 0 2012 13 14 15 16 17 18 19 20 21 22 23 24 25 26 27 28 29 2030 1) Ukraine, Belarus, India, China, Turkey, VIetnam, Bangladesh Source: WNA, press releases, Roland Berger nuclear database
India sees strong nuclear development activity with installed capacity expected to double until 2030 Scenario considered for India OVERVIEW ON INDIA CURRENT STATUS CHANGES IN INDIA INSTALLED CAPACITY [# reactors] • Recent development • India has affirmed plans to boost nuclear capacity to 63 GW by 2032, doubling current capacity in service by 2015 • 2 reactors entered recently into construction: Kakrapar 4 and Rajasthan 7 (630 MW each) • Some delays are expected for reactors under construction due to public protests (Kudankalam 1&2). All reactors being built in India are potentially concerned by such delays as India is a democratic country with strong power given to local authorities LOW Under construction Operating • 80 • 60 50 49 49 49 49 • 49 49 49 49 49 49 49 49 44 39 36 • 40 31 30 27 • 20 0 2012 13 14 15 16 17 18 19 20 21 22 23 24 25 26 27 28 29 2030 HIGH • 80 • 62 • 62 • 62 • 62 • 62 • 62 • 62 • 62 • 62 • 62 • 62 • Roland Berger scenarios • High: considering delays, about a half of the reactors under construction or planned enter service by 2030 • Low: all reactors are somehow delayed • 60 • 50 • 49 • 44 39 36 • 40 31 30 27 • 20 0 2012 13 14 15 16 17 18 19 20 21 22 23 24 25 26 27 28 29 2030 Source: WNA, press releases, Roland Berger nuclear database
BRICs are also at the forefront regarding SMRs; global market promises ~40 GW potential for SMRs in 2020-2030 Market potential1)2)3) – selected top markets [GW] 2,5 Desalination Electricity, heat 1,6 2,3 1,5 0,9 9,2 0,8 14,7 0,7 1)Market share in most countries – 10-15% (Russia & Kazakhstan – 50%) 2) Based on opinions of 3 independent experts, IEA, specialized national institutions, UxC, WNA 3) USA, Canada, Saudi Arabia – are also large markets, however were not studied in detail due to "Russian" focus Source: Roland Berger
North, North-east and South are most likely areas for SMR in China Geography of SMR – China COMMENTS • North, North-east and South of China have the largest potential for SMR • These regions have • A number of large urban centers – concentration of consumers • Lower density of infrastructure (electric networks, gas pipelines, railroads, desalination facilities, cogeneration facilities) – demand for small / medium capacity units • Locations with energy tariffs above average (71 USD / MWh – blue dots) – SMR can be competitive • Acceptable seismic and other requirements Harbin Changchun Beijing Shenyang Hohhot Dalian Shijiazhuang Yinchuan Tianjin Taiyuan Qingdao Xining Lanzhou Jinan Jiangsu Linxia Nanjing Xi'an Hefei Hangzhou Shanghai Wuhan Chongqing Ningbo Nangchan Changsha Guiyang Fuzhou Xiamen Kunming Nanning Guangzhou Shenzhen Haikou Source: Roland Berger
North-west, Urals, Siberia have the highest potential for SMR in Russia Geography of SMR – Russia COMMENTS • Most likely areas in Russia • North-west • Urals • Siberia • Prerequisites • Vast areas and distance of industrial centers from main grid – conductive for SMR • Locations with energy tariffs above average (58 USD / MWh – green areas) – SMR can be competitive • Acceptable seismic and other requirements Murmansk Oblast' Republic of Karelia YaNAO MOSCOW KhMAO Belgorod Oblast' Sverdlovsk Oblast' KrasnoyarskiyKrai Republic of Bashkortostan Irkutsk Oblast' Novosibirsk Oblast' Astrakhan' Oblast' Republic of Buryatia North Ossetia Orenburg Oblast' Kemerovo Oblast' Dagestan Republic Republic of Khakassia Source: Roland Berger
There is a number of major industrial projects which could be clear clients for SMR in Russia Russia – Selected project as potential clients for SMR 2015-2030 COMMENTS Example Industry • In Russia demand is expected from • New industrial clusters – large power demand, often away from main grid, a number of projects already in the pipeline • Large transport infrastructure projects – large power demand • Deficitregions – such as Belgorod, Kaluga PROJECTS ∼ 2015-2030 • Iron ore mining (Buryaniya) • Mining • Diamond field(Yakutiya, Krasnoyarsky region • Mining • Uranium mine, ElkonskyGMK(Yakutiya) • Mining • Gold mine "Peschanka" (Chukotsky region) • Mining ADDITIONAL • Compensation for power deficit in Belgorod region • Energy • Compensation for power deficit in Kaluga region • Energy Source: Roland Berger
14 There is a number players currently trying to develop an SMR technology Various SMR technologies under development [for SMR <350 MW] Investments Electric capacity Coolant temperature6) Non-electric application7) Construction time SMR Type Efficiency Fuel cycle Refuelling Useful life CAREM-25 • LWRWUP1) • 25 MW • 23% • 325 °C • DS • Open • 11 months • 60 months • $3500 / kW • 60 years CNP-300 • LWRWUP • 325 MW • 33% • 315 °C • - • Open • 14 months • 72 months • $2800 / kW • 40 years • LWRWUP • 100 MW • 30% • 325 °C • DS • Open • 36 months • 36 months • $5500 / kW • 60 years SMART • LWRWUP • 225 MW • 28% • n.a. • - • Open • 24 months • 36 months • n.a. • 60 years SMR 200 • LWRWUP • 45 MW • 28% • 290 °C • DS + CG • Open • 24 months • 36 months • $4000 / kW • 60 years nuScale • LWRWUP • 125 MW • 31% • 320 °C • - • Open • 60 months • 36 months • $5200 / kW • 60 years mPower • LWRWUP • 145 MW • 31% • 305 °C • - • Open • 36 months • 36 months • $4700 / kW • 60 years HI-SMUR AHWR • HWR2) • 300 MW • 31% • 285 °C • DS • Open / closed • n.a. • 72 months • $3500 / kW • 100 years • HTGCR3) • 105 MW • 42% • 750 °C • - • Open • n.a. • 48 months • $2500 / kW • 40 years HTR-PM • HTGCR • 285 MW • 48% • 850 °C • DS + CG + H • Open / closed • 24 months • 48months • n.a. • 60 years GTHTR-300 • HTGCR • 240 MW • 48% • 850 °C • CG • Open • 360 months • 60months • n.a. • 60 years EM2 • FNRLB4) • 100 MW • 36% • 480 °C • DS + CG + H • Open / closed • 84 months • 36-48 mnths • $4500 / kW • 60 years SVBR-100 • FNR LB • 25 MW • 36% • 500 °C • DS + CG + H • Open • 120 months • 48months • n.a. • 60 years Hyperion • FNRN5) • 310 MW • 37% • 500 °C • - • Closed • 24 months • 48months • n.a. • 60 years PRISM • FNR N • 10 MW • 33% • 355 °C • DS + CG + H • Open • 360 months • 36months • n.a. • 30 years 4S 1) Light Water Reactors with Water Under Pressure 2)Heavy Water Reactors 3) High Temperature Gas-Cooled Reactors 4) Fast Neutron Reactor with lead-bismuth coolant5) Fast Neutron Reactor with natrium coolant 6) At the exit of active zone 7) CG – cogeneration; DS - desalination; H – production of hydrogen
Russian SMR is likely to be among the first on the market – reference project scheduled for 2016-2018 SMR development plans [for SMR <350 MW] COMMENTS 13 14 15 16 17 18 19 20 21 22 23 24 25 SMR projects • Advantages of Generation SMR IV • High passive safety • Advanced technical/economic parameters (Gen III show only minor improvement against their "large brothers") • Most Generation IV are not expected until 2020 – except Russian project • Russian project could be interested to find a partner for joint promotion on the international markets GENERATION III LWRwith WUP1) CNP-300 (China) CAREM-25 (Argentina) SMART (S. Korea) SMR 200, nuScale, mPower(USA) HI-SMUR (USA) HWR2) AHWR (India) GENERATIONIV HTGCR3) HTR-PM (China) GTHTR-300 (Japan), EM2 (USA) FNRwith LB4) SVBR-100 (Russia) Hyperion (USA) FNR with N5) PRISM (USA), 4S (Japan) Licensing Construction of reference project Project start Commercial orders / projects 1) Light Water Reactors with Water Under Pressure 2) Heavy Water Reactors 3) High Temperature Gas-Cooled Reactors 4) Fast Neutron Reactor with lead-bismuth coolant 5) Fast Neutron Reactor with natrium coolant 6)Exceptions – CNP-300 (2 units in Pakistan) andHTR-PM (up to 18 unitsх 210 MWin China) Source: Roland Berger
Financing risks and requirements are substantial; solutions need to include a wide spectre of instruments and contributions Nuclear projects carry a unique financial risk profile – sheer project volume, long investment periods, widespread overruns of time and financial budgets, market uncertainty, political discontinuity, financial capacity and solidity of host countries Financial risks are particularly severe for private sector nuclear players (financing capacity, credit rating), and for all investments "abroad" Financing solutions 1 – project volume and long investment periods: building of consortia (one operator, 4-6 co-investors – strategic and financial), mergers & acquisitions, government incentives during construction phase or upon commissioning (example: US renewables): tax credits, free CO2 certificate allocation, capacity payments Financing solutions 2 – market uncertainty and political discontinuity: capacity payments, fixed power tariffs, debt/mezzanine financing with success-based interest rates, substantial financial commitment of host countries (state, institutions, private investors) Financial solutions 3 – financial capacity and solidity of host countries: nuclear portfolio diversification, guarantees by international institutions, limited liability constructs Source: Roland Berger