1 / 16

Variations of Solar Acoustic Radius from GONG low-L data

Variations of Solar Acoustic Radius from GONG low-L data. Shukur Kholikov NSO/GONG. Outline. Auto-correlation analysis Data: GONG, BISON, VIRGO/SPM Large separation or acoustic radius measurements Results Meridional flows from SH zonal modes Conclusions and future work. ACF.

Download Presentation

Variations of Solar Acoustic Radius from GONG low-L data

An Image/Link below is provided (as is) to download presentation Download Policy: Content on the Website is provided to you AS IS for your information and personal use and may not be sold / licensed / shared on other websites without getting consent from its author. Content is provided to you AS IS for your information and personal use only. Download presentation by click this link. While downloading, if for some reason you are not able to download a presentation, the publisher may have deleted the file from their server. During download, if you can't get a presentation, the file might be deleted by the publisher.

E N D

Presentation Transcript


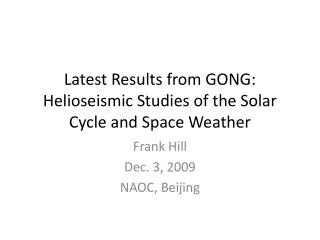
  1. Variations of Solar Acoustic Radius from GONG low-L data Shukur Kholikov NSO/GONG

  2. Outline • Auto-correlation analysis • Data: GONG, BISON, VIRGO/SPM • Large separation or acoustic radius measurements • Results • Meridional flows from SH zonal modes • Conclusions and future work

  3. ACF

  4. Large separations from GONG frequencies

  5. Large separations from BISON frequencies

  6. Large separations from ACF L= 0, 2

  7. Travel times: GONG

  8. Correlation with the activity

  9. Relative changes of acoustic radius: MDI, GONG

  10. Relative changes of acoustic radius: BISON

  11. Relative changes of acoustic radius: VIRGO/SPM

  12. Conclusions • Precise measurements of large separation • Possibly we may estimate change of upper reflection boundary during the activity cycle • Applicable to astroseismology, stellar activity

  13. Meridional travel time differences using GONG (m=0) SH time series L=0-200

  14. Average CCF T=1 gong month ∆=17º =3 mHz

  15. Comparison travel time differences Directly from velocity images From M=0 SH coefficients From reconstructed images using all-L SH coefficients

  16. Average travel time differences

More Related