Download
1 / 11
140 likes | 386 Views
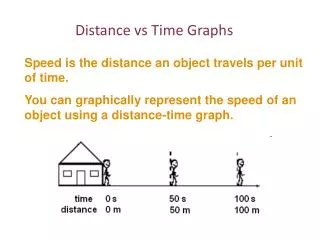
If intervals between distance & time intersection points are same; graph represents object moving at CONSTANT VELOCITY; NO ACCELERATION a = 0 SLOPE of a distance/time graph represents the VELOCITY of the object greater slope = greater velocity

E N D
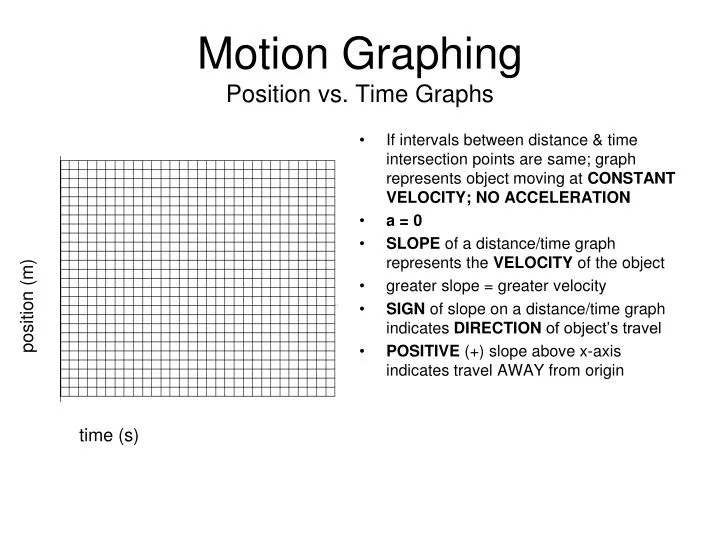
If intervals between distance & time intersection points are same; graph represents object moving at CONSTANT VELOCITY; NO ACCELERATION a = 0 SLOPE of a distance/time graph represents the VELOCITY of the object greater slope = greater velocity SIGN of slope on a distance/time graph indicates DIRECTION of object’s travel POSITIVE (+) slope above x-axis indicates travel AWAY from origin Motion GraphingPosition vs. Time Graphs position (m) time (s)
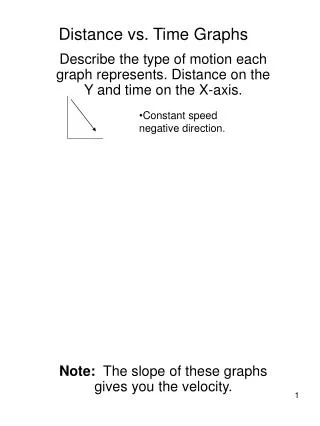
If intervals between distance & time intersection points are same; graph represents object moving at CONSTANT VELOCITY; NO ACCELERATION a = 0 SLOPE of a distance/time graph represents the VELOCITY of the object greater slope = greater velocity SIGN of slope on a distance/time graph indicates DIRECTION of object’s travel NEGATIVE (-) slope above x-axis indicates travel TOWARDS origin Motion GraphingPosition vs. Time Graphs position (m) time (s)
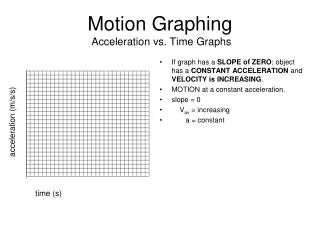
If graph has a SLOPE of ZERO; object has a VELOCITY and ACCELERATION of ZERO and is at rest in the same position. NO MOTION slope = 0 Vav = 0 a = 0 Motion GraphingPosition vs. Time Graphs position (m) time (s)
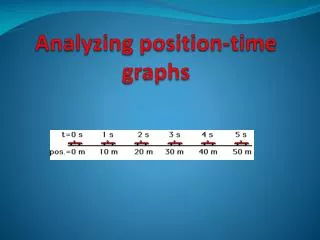
If intervals between distance & time intersection points are increasing; graph represents object with INCREASING VELOCITY. VELOCITY NOT CONSTANT Object has POSITIVE (+) ACCELERATION a = DV D t Average velocity (vav) is the slope of the line between any two points on the position-time graph. Instantaneous velocity (vinst) is the slope of the tangent line through one point on the position-time graph. Motion GraphingPosition vs. Time Graphs position (m) time (s)
If intervals between distance & time intersection points are increasing; graph represents object with INCREASING VELOCITY. VELOCITY NOT CONSTANT Object has NEGATIVE (-) ACCELERATION due todirection a = DV D t Average velocity (vav) is the slope of the line between any two points on the position-time graph. Instantaneous velocity (vinst) is the slope of the tangent line through one point on the position-time graph. Motion GraphingPosition vs. Time Graphs position (m) time (s)
Graph of a VERTICAL line is UNDEFINED Slope of line DOES NOT equal zero. Object cannot be doing TWO things at SAME time. Motion GraphingPosition vs. Time Graphs position (m) time (s)
If intervals between velocity & time intersection points are same; graph represents object moving with INCREASING VELOCITY; CONSTANT ACCELERATION a = DV D t SLOPE of a velocity/time graph represents the ACCELERATION of the object greater slope = greater acceleration SIGN of slope on a velocity/time graph indicates change in velocity POSITIVE (+) slope indicates object increasing speed Positive slope below x-axis indicates object decreasing speed There is NO RELATIONSHIP between object and ORIGIN shown on graph. Motion GraphingVelocity vs. Time Graphs velocity (m/s) time (s)
If intervals between velocity & time intersection points are same; graph represents object moving with DECREASING VELOCITY; CONSTANT NEGATIVE ACCELERATION a = -DV D t SLOPE of a velocity/time graph represents the ACCELERATION of the object greater slope = greater acceleration SIGN of slope on a velocity/time graph indicates change in velocity NEGATIVE (-) slope indicates object decreasing velocity Negative slope below x-axis indicates object increasing velocity Motion GraphingVelocity vs. Time Graphs velocity (m/s) time (s)
If graph has a SLOPE of ZERO; object has a CONSTANTVELOCITY and ACCELERATION of ZERO. MOTION at a constant velocity slope = 0 Vav = constant a = 0 Motion Graphing*Velocity vs. Time Graphs velocity (m/s) time (s)
If intervals between velocity & time intersection points are increasing; graph represents object with increasing ACCELERATION. Object has POSITIVE (+) ACCELERATION a = DV D t Average acceleration (aav) is the slope of the line any two points on the velocity-time graph. Instantaneous acceleration (ainst) is the slope of the tangent line through one point on the velocity-time graph. Motion Graphing Velocity vs. Time Graphs velocity (m/s) time (s)
If intervals between velocity & time intersection points are increasing; graph represents object with decreasing ACCELERATION. Object has NEGATIVE (-) ACCELERATION -a = DV D t Average velocity (vav) is the slope of the line between any two points on the position-time graph. Instantaneous velocity (vinst) is the slope of the tangent line through one point on the position-time graph. Motion Graphing Velocity vs. Time Graphs velocity (m/s) time (s)