Download
1 / 23
230 likes | 400 Views
The Magruder Plots A Century of Wheat Research in Oklahoma. A.C. Magruder 1867-1924. Horace J. Harper 1895-1963. Robert L. Westerman Oklahoma State University. P. Check. NPK. 1920-1930. 100’. 10’. (6) Nitrogen, Phosphorus, Potash and Lime 60-30-30+Lime.

E N D
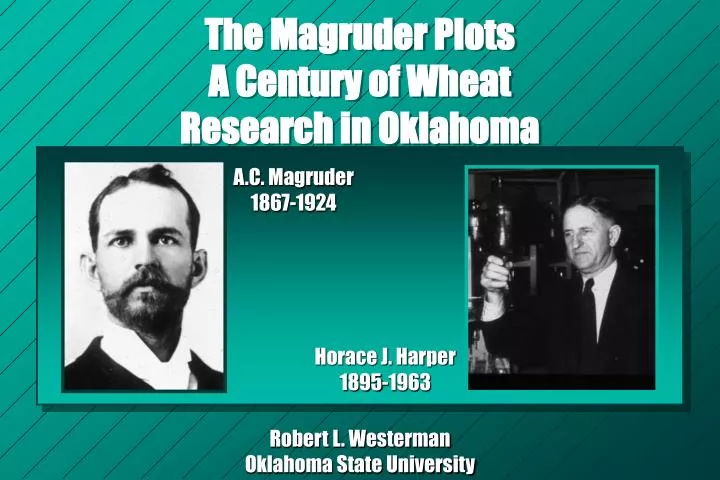
The Magruder PlotsA Century of Wheat Research in Oklahoma A.C. Magruder 1867-1924 Horace J. Harper 1895-1963 Robert L. Westerman Oklahoma State University
P Check NPK 1920-1930
100’ 10’ (6) Nitrogen, Phosphorus, Potash and Lime 60-30-30+Lime (5) Nitrogen, Phosphorus and Potash 60-30-30 Magruder Plots 1947-present Stillwater Experiment Station (4) Nitrogen and Phosphorus 60-30-0 125’ (3) Phosphorus 0-30-0 (2) Check (1) Manure every four years at 240 lbs N/ac
Treatments • Manure 1892, 240 lb N/ac every 4 yr • Check 1892, no nutrients applied • P 1929, 30 lb P2O5/ac/yr • NP 1929, 60 lb N and 30 lb P2O5/ac/yr, • NPK 1929, 60 lb N, 30 lb P2O5 and 30 lb K2O/ac/yr • NPKL 1929, 60 lb N, 30 lb P2O5 , 30 lb K2O/ac/yr and lime (1954)
Changes • Plots relocated in 1947 • 0-6 and 6-15” profiles moved separately • Variety • Fultz, Currell, Kharkov, Turkey, Tenmarq, Pawnee • Ponca, Concho, Kaw, Scout 66, Triumph 64, Osage • TAM W 101, Karl, Tonkawa • N Rate • 33 lb N/ac 1892-1967 • 60 lb N/ac 1968-present • N Source: NaNO3 and NH4NO3 • P Source: OSP, TSP
100 100 100 80 80 80 60 60 60 Reliability Reliability Reliability 40 40 40 N N N 20 20 20 P P P K K K 0 0 0 1930-1937 1938-1947 1948-1957 1958-1967 1968-1977 1978-1987 1988-1994 1930-1937 1938-1947 1948-1957 1958-1967 1968-1977 1978-1987 1988-1994 1930-1937 1938-1947 1948-1957 1958-1967 1968-1977 1978-1987 1988-1994
Stability Analyses K Response in Stress Environments 55 55 55 Manure y = -7.59 + 1.40x r = 0.92 Manure y = -7.59 + 1.40x r = 0.92 Manure y = -7.59 + 1.40x r = 0.92 Check y = 3.97 + 0.51x r = 0.76 Check y = 3.97 + 0.51x r = 0.76 Check y = 3.97 + 0.51x r = 0.76 P P y = 3.03 + 0.57x r = 0.57 y = 3.03 + 0.57x r = 0.57 P y = 3.03 + 0.57x r = 0.57 45 45 45 NP y = -4.06 + 1.28x r = 0.87 NP y = -4.06 + 1.28x r = 0.87 NP y = -4.06 + 1.28x r = 0.87 NPK y = 2.73 + 1.07x r = 0.88 NPK y = 2.73 + 1.07x r = 0.88 NPK y = 2.73 + 1.07x r = 0.88 NPK+L y = 2.89 + 1.13x r = 0.89 NPK+L y = 2.89 + 1.13x r = 0.89 NPK+L y = 2.89 + 1.13x r = 0.89 35 35 35 Grain yield, bu/acre Grain yield, bu/acre Grain yield, bu/acre 25 25 25 15 15 15 5 5 5 10 20 30 40 10 20 30 40 10 20 30 40 Environment mean, bu/acre Environment mean, bu/acre Environment mean, bu/acre
8 8 8 Manure Manure Manure Check Check Check 7.5 7.5 7.5 P P P NP NP NP NPK NPK NPK 7 7 7 NPKL NPKL NPKL Soil pH 6.5 Soil pH 6.5 Soil pH 6.5 6 6 6 5.5 5.5 5.5 5 5 5 4.5 4.5 4.5 1930 1940 1950 1960 1970 1980 1990 2000 1930 1940 1950 1960 1970 1980 1990 2000 1930 1940 1950 1960 1970 1980 1990 2000 Year Year Year
4 Manure Check 3.5 3 Soil organic matter, % 2.5 2 1.5 1 1880 1900 1920 1940 1960 1980 2000 Year
0.18 Manure Check 0.16 0.14 0.12 Total soil N, % 0.1 0.08 0.06 0.04 1880 1900 1920 1940 1960 1980 2000 Year
Grain Yield Trend 40 Environment Mean 30 Grain yield, bu/ac 20 10 0 1890 1910 1930 1950 1970 1990 Year
All Experiments 50 y = 0.2105x - 388.79 45 R = 0.2105 2 40 35 30 Average Yield, bu/ac 25 20 15 10 5 0 1930 1940 1950 1960 1970 1980 1990 2000 Year
Conclusions • Manure applications were shown to increase yields very early in the study • Applied P fertilizer increased grain yields (1930-57), but no increases were found as a result of applying N, K or lime up to 1957 • After 100 years of cultivation and continuous wheat production, N is deficient for crop production on this soil. Now, N, P and K are required for maximum yields
Application of commercial fertilizer has improved yields as much as applications of barnyard manure • Potassium addition had no notable effect on crop yields until 1988, but since that time has been needed for maximum yields. Liming has only been slightly beneficial at this location • Soil organic matter has declined from 4.0% to <1.25% and has tended to stabilize. Barnyard manure has slowed the decay of soil organic matter compared to the unfertilized plot. • Long-term relevancy achieved via the use of simple treatment structure.
Soil test indices for P and K have been increased to adequate levels by continuous application of phosphorus and potassium fertilizer and barnyard manure applications. • The initial objective of this study was to determine how long this reddish prairie soil could produce wheat. After 100 years of soil fertility research with multiple variables on continuous wheat, the question remains unanswered. It has been shown that inorganic fertilizer applications as well as manure applications result in sustainable and environmentally acceptable agricultural production systems.