Download
1 / 9
100 likes | 130 Views
GUM bottom up and top down approaches for measurement uncertainty evaluation have their own advantages and disadvantages. https://consultglp.com/

E N D
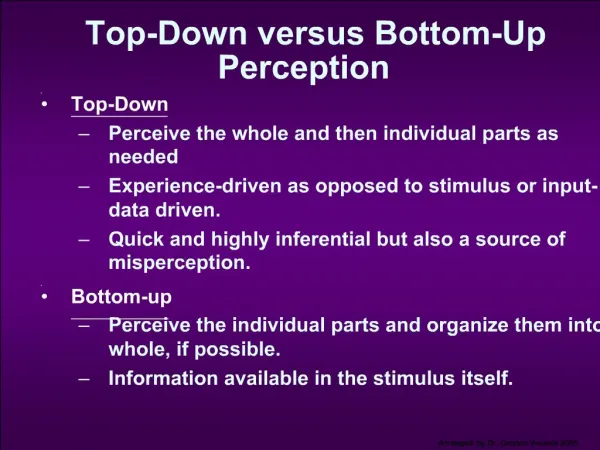
A top-down approach in evaluating measurement uncertainty by the control chart method By Yeoh Guan Huah GLP Consulting, Singapore Introduction The popular “bottom-up” GUM method (ISO/IEC Guide 98) used for estimating the measurement uncertainty in chemical analysis has been found to be tedious and time-consuming although it has the advantage of critically reviewing the test procedure for uncertainty components in each step. There are also uncertainty components in the method that cannot be readily quantified. Moreover, the measurement uncertainty of the analytical procedure by GUM does not necessarily reflect the current situation of the testing in the laboratory unless it is regularly updated. Many learned organizations have since been advocating the wholesome “top-down” performance of the test method in terms of its precision and reproducibility, after recognizing that most, if not all, accredited laboratories would have a quality management system in place to monitor the accuracy and reliability of their analytical results generated. Their quality management system would have covered the routine use of certified reference materials (CRMs) or laboratory prepared quality control check (LCS) samples, and participated in various proficiency testing programs to dynamically assure the quality of work in real time. Hence, the adoption of the routine quality control data over an extended period of time is a good indication of the laboratory quality. The statistical useful data generated can be presented as the measurement uncertainty of the test method concerned. Current interests on using the “top-down” approaches include the use of quality control chart (ASTM D6299), linear regression of reference materials (ISO 11095) and the adoption of data from the method precision, accuracy and trueness (ISO 21748). This paper discusses the use of Shewhart chart control and EWMA chart control methods for evaluating the uncertainty of measurement in chemical analysis. The Quality Control Chart Control charts are used to routinely monitor quality. A Shewhart control chart is a graphic display of the results of one quality parameter versus time or the number of sample analyzed. In general, the chart consists of a centre line which represents the mean value for the lot of analysis and two other horizontal lines called the upper control limit (UCL) and lower control limit (LCL) are also shown on the chart. These control limits are chosen so that almost all of the data points fall within these limits as long as the Control chart method for MU Page 1
analytical procedure is in statistical control. Upper and lower warning (UWL & LWL) limits can also be inserted in the chart to forewarn any trend of data moving out of control. This top-down method requires a laboratory to show that its test method is under intermediate reproducibility control, and to analyse a series of its QC or LCS sample analysis without outliers using the Anderson Darling (AD) statistic test to confirm that the data produced are normally distributed and independent to each other. The standard deviation of the moving range (MR) of the data is the standard uncertainty (u) of the analytical procedure and after multiplying a coverage factor (k) of 2, the expanded uncertainty is taken to be the uncertainty of the test method. Since the control chart method is a dynamic process, new data will be added regularly to update the trend of its uncertainty in real time and hence the measurement uncertainty estimation will also be up-to-date accordingly. Some useful ISO definitions Reproducibility Reproducibility is a measure of precision derived under reproducibility conditions, i.e. test results are obtained with the same method on identical test samples in different laboratories with different operators using different equipment. Intermediate reproducibility Intermediate reproducibility is a measure of reproducibility derived under reproducibility conditions within a single laboratory Range The range is the difference between the lowest and the highest data points. Moving Range (MR) The moving range is the difference between two successive data points. It shows the stability of the data and is often presented in a moving range chart to more clearly illustrate its trend. Control chart method for MU Page 2
Anderson Darling statistic equations for data normality and independence n ∑ [ ] − + − (2 1) ln( ) ln(1 ) i p p + − 1 i n i 2 = 1 i = − − A n ………………………………………[1] n . 0 75 . 2 25 2 * 2 = + + 1 ( ) A A 2 n n …………………………………………………………………………………..…[2] where: A2is the AD normal statistic estimate A2* is the corrected AD normal statistic estimate pi is the normal probability value at data point i. n is the number of data point The evaluations of As 2* results are as follows: 2* and AMR 2* 2* MR <1.0 accept that the data points are normal and independent, and An Example of MU Evaluation The top-down approach using the control chart method can be illustrated in the analysis of acetone in water as described below. The USEPA method 8260C was used in the analysis of trace acetone in water by the purge-and- trap/GCMS technique. A batch of laboratory control check samples (LCS) of 20 µg/L was prepared and subjected to routine analysis under intermediate reproducibility conditions with different analysts on different days in the same laboratory. The following set of 30 data was collected over time and there were no significant outliers detected under the Dixon’s Q test: a) <1.0 and s A A the control charts can be set up. 2* 2* MR b) >1.0 and >1.0 indicate that the quality system is out of control ; s A A 2* 2* MR c) <1.0 and >1.0 indicate that the data points are not fully independent on s A A each other. Control chart method for MU Page 3
Table 1 : Summary of analysis result on a LCS with 20 µ µ µ µg/L acetone in water Day# 1 2 3 4 5 6 7 8 9 10 x(i) and the calculated MR results were presented in Table 2. Table 2 : Display of xiand calculated |MR| results over time 19.77 19.68 22.68 21.01 20.84 19.86 21.90 18.47 23.01 19.78 Day# 11 12 13 14 15 16 17 18 19 20 x(i) 18.20 20.50 16.14 16.42 21.56 19.37 19.77 20.81 16.74 22.16 Day # 21 22 23 24 25 26 27 28 29 30 x(i) 22.99 20.88 18.31 22.13 22.46 17.62 18.94 22.09 19.16 21.14 The daily moving range of the data in absolute figure was calculated by the following equation: | 1 i i i x x MR − = + | ……………………………………………………..[3] Day # 1 2 3 4 5 6 7 8 9 10 11 12 13 14 15 Day # 16 17 18 19 20 21 22 23 24 25 26 27 28 29 30 xi |MR| 0.09 3.00 1.67 0.17 0.98 2.04 3.43 4.54 3.23 1.58 2.30 4.36 0.28 5.14 xi |MR| 2.19 0.40 1.04 4.07 5.42 0.83 2.11 2.57 3.82 0.33 4.84 1.32 3.15 2.93 1.98 19.77 19.37 19.68 19.77 22.68 20.81 21.01 16.74 20.84 22.16 19.86 22.99 21.90 20.88 18.47 18.31 23.01 22.13 19.78 22.46 18.20 17.62 20.50 18.94 16.14 22.09 16.42 19.16 21.56 21.14 ____ MR =2.407 µg/L and _ x = 20.15 µg/L, standard deviation s = 1.846 µg/L, On calculation, the | | ____ MR /1.128 = 2.134. ( Note that s the intermediate reproducibility standard deviation sR’= = | | ____ MR ____ MR = d2x sR’ = 1.128 x sR’as defined by Ref: ISO 8258.) The expanded uncertainty U = 2 x sR’ | = 4.27 µg/L. | Control chart method for MU Page 4
However before concluding the measurement uncertainty study, further statistical prerequisites are to be fulfilled as follows: a.AD statistic test for data normality and independence The data points were re-arranged in ascending order and for each data xi, a normalized value wiwas calculated as below: __ − x x i = w ………………………………………………..[4] i s where s = standard deviation of the mean. The normalized probability value pifor wi was then calculated accordingly. If an Excel spreadsheet is used, a function : __ s x x NORMDIST i = could be used to calculate the pi. Hence, As Similar approach was used to calculate wMR for the 29 moving range data and the pi,MR by using the Excel function : __ s x x NORMDIST = could be used to calculate the pi. In here, AMR 2* = 0.343. ( , , ) 2* = 0.332. ( , , ) i MR Since both As were normally distributed and independent to each other. 2* and AMR 2* were less than 1.00, it was concluded that the analytical data b.Plotting and interpretation of control chart After confirming the normality and independence characteristics of the data by the AD test, a control chart was constructed by determining its UCL and LCL: 3 R UCL x s = + = 26.55 µg/L ' = − = 13.74 µg/L 3 LCL x s ' R The table 3 of ISO 8258:1991 shows the following constant factors for estimating the upper control limit of moving range: Control chart method for MU Page 5
No. of moving range,n To construct the control limits for MR, the following equation as per ISO 8258 were used: Since the MR was between two successive data, D4= 3.267 was used in the UCLMR calculation. It was found to be 7.86. Hence, the control charts were presented respectively in Fig 1 and Fig 2. Constant d2 Constant D4 2 1.128 3.267 3 1.693 2.574 4 2.059 2.282 5 2.326 2.114 _____ MR _____ MR = × = . 3 267 UCLMR D 4 Fig 1: QC Chart for acetone in water 27.00 UCL 25.00 23.00 21.00 19.00 x(i) 17.00 15.00 LCL 13.00 11.00 0 10 20 30 40 Fig 2: Control chart of Moving Range 8.00 UCLMR 7.00 6.00 5.00 4.00 Serie… 3.00 2.00 1.00 0.00 0 10 20 30 40 Control chart method for MU Page 6
Use of EWMA statistic If there is reason to suspect a co-existent of the data’s random and systematic error, and to check any influence of the old data to the existing ones, a further verification can be made by checking a EWMA statistic. The Exponentially Weighted Moving Average (EWMA) is a statistic for monitoring the analytical process that averages the data in a way that gives less and less weight to data as they are further removed in time. For the Shewhart chart control technique, the decision regarding the state of control of the analysis at any time, t, depends solely on the most recent measurement from the testing, and, of course, the degree of ‘trueness’ of the estimates of the control limits from historical data. For the EWMA control technique, the decision depends on the EWMA statistic which is an exponentially weighted average of all previous data, including the most recent ones. If the mean of the historical data ………………………………..[5] then, i i i x EWMA EWMA λ λ + − = −1 ) 1 ( ………………………………………..[6] where, i= 1,2,3, ….n xi is the observation at time i, n is the number of observations including EWMA0 and, 0 < λ < 1 is a weighting constant that determines the depth of memory of the EWMA The constant λ determines the rate at which the ‘older’ data enter into the calculation of the EWMA statistic. A smaller value of λ gives more weight to the old data and less weight to the recent ones. However, the choice of λ is somewhat arbitrary. The ASTM D6299 suggests to use λ = 0.4. Using the above example on the analysis of acetone in water , the EWMA data were calculated and summarized in Table 3: Table 3 : Calculation of EWMA from the analytical data of acetone in water Day # x(i) EWMA(i) 1 19.77 19.77 2 19.68 19.73 3 22.68 20.91 4 21.01 20.95 5 20.84 20.91 6 19.86 20.49 7 21.90 21.05 8 18.47 20.02 9 23.01 21.22 10 19.78 20.64 11 18.20 19.66 = EWMA x 0 0 Day # 16 17 18 19 20 21 22 23 24 25 26 x(i) 19.37 19.77 20.81 16.74 22.16 22.99 20.88 18.31 22.13 22.46 17.62 EWMA(i) 19.27 19.47 20.01 18.70 20.08 21.25 21.10 19.98 20.84 21.49 19.94 Control chart method for MU Page 7
12 13 14 15 20.50 16.14 16.42 21.56 20.00 18.46 17.64 19.21 27 28 29 30 18.94 22.09 19.16 21.14 19.54 20.56 20.00 20.46 The equations for the upper and lower control limits for EWMA data are: ……………………………………………….[7] λ λ − 2 Hence, UCLλ = 23.35 µg/L and LCLλ = 16.95 µg/L. The EWMA chart is presented in Fig 3. Figure 3: The control chart of xiand EWMAi of analytical data λ − = + 3 UCL x s λ ' R λ 2 _ x = − 3 LCL R s ………………………………………………. [8] ' λ 28.00 UCL 26.00 24.00 UCLλ 22.00 x(i) 20.00 EWMA(i) 18.00 LCLλ 16.00 14.00 LCL 12.00 0 10 20 30 40 It can be concluded that the analytical process was in statistical control as all the data (raw and EWMA) fell within their respective control limits, and hence the method has an expanded uncertainty of 4.27 µg/L for an mean value of 20.15 µg/L with 95% confidence. Conclusion The top-down approach advocates the evaluation of the measurement uncertainty from the overall performance of an analytical method. For a well quality controlled laboratory with proper QA/QC protocols in place, the routine quality control data are the readily sources to be tapped in evaluating the uncertainty of the measurement. However, a point of caution is to be noted. The Control chart method for MU Page 8
LCS or CRM used in the control chart technique should be as close to the samples taken for the routine analysis in terms of matrix and concentration levels. If the range of concentration is rather large, three levels of analyte concentrations (low, medium and high) are to be run routinely. This control chart method runs excellently for regular analysis on samples with fairly consistent matrix and concentration level. Control chart method for MU Page 9