Download
1 / 10
100 likes | 193 Views
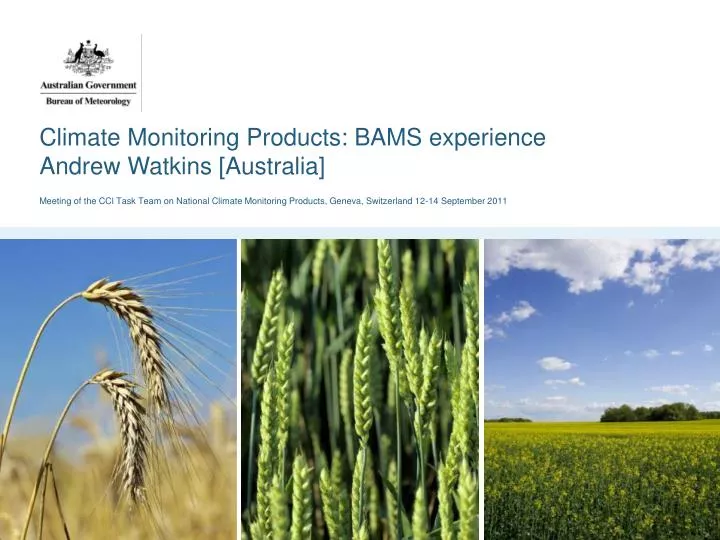
Climate Monitoring Products: BAMS experience Andrew Watkins [Australia]. Meeting of the CCl Task Team on National Climate Monitoring Products, Geneva, Switzerland 12-14 September 2011. BAMS: The Regional Climate chapter. The 2009 edition… 1 Editor-in-chief (Dr. Deke Arndt)

E N D
Climate Monitoring Products: BAMS experience Andrew Watkins [Australia] Meeting of the CCl Task Team on National Climate Monitoring Products, Geneva, Switzerland 12-14 September 2011
BAMS: The Regional Climate chapter • The 2009 edition… • 1 Editor-in-chief (Dr. Deke Arndt) • 2 editors (Dr. Andrew Watkins [Australian Bureau of Meteorology, Dr. Lucie Vincent [Environment Canada]) • 55 pages • 82 Authors • ~25,750 words • 56 figures • 5 tables • 6 “Blue Boxes” • 7 Main Sections • 27 countries or regions
BAMS: The Regional Climate chapter Fig 7.1. Annual mean temperature anomalies for Canada, 1948–2009. The reference period is 1951–80. (Source: Environment Canada.) Fig. 7.3. Annual mean temperature for the contiguous United States, 1895–2009. (Source: NOAA/NCDC.) • While inputs are excellent and contributors enthusiastic and to be fully complimented… • Different base periods (61-90, 71-2000, local base periods e.g., 79-95) • Different reporting methods (percentages of normal/below normal/anoms, deciles, anomalies, percentciles, totals,) • Different ranking periods (e.g., start in 1900, 1970, 2000 etc) • Different units (rainfall mm vs inches vs points) • Different terminology (mean/normal/average) • Local acronyms • Different Tropical Cyclone scales • Different use of term “average temperature” (maximum or mean)
BAMS: The Regional Climate chapter • Also… the more general graphical and mapping techniques used, e.g., • Line vs column graphs • grid vs smoothed/contoured plots • trend lines vs running means • colours and styles • incomplete captions • Different seasons (NH: winter = SH summer) • seasons not matching calendar years • The way information is presented makes a big difference to how it can be interpreted. Half full or half empty?
BAMS: The Regional Climate chapter Solution… attempt to standardise. How? Provide a guide for authors… • Base period • Precipitation; average annual totals, relative values (anomalies, rankings, percentiles, deciles), Significant events, drivers for events • Temperature; average annual temperature (meanTmax + meanTmin/2), rankings, anomalies, percentiles • Significant events… Heatwaves and cold snaps, Tornadoes, Dust storms, Fires, Floods, Severe storms,Tropical Cyclones • 4. Significant statistics
BAMS: The Regional Climate chapter Significant Statistics: • Mean annual maximum temperature anomaly • Mean annual minimum temperature anomaly • Mean annual rainfall anomaly • Highest temperature (including location and date) • Lowest temperature (including location and date) • Highest rainfall (including location and date) • Lowest rainfall (including location(s) and date) • Highest wind speed • Greatest snow depth
BAMS: The Regional Climate chapter How did we go?? • Feedback was that the guide assisted users • Greater emphasis on putting values into an historical context • Structure largely adhered to. • But… many reports were similar to past reports • List of significant statistics – only received from Australia, New Zealand and sub-set from Nordic Countries (removed) • Still a lot of work for the editors!! • (Base periods and rankings especially)
BAMS: The Regional Climate chapter What did we need to do better? • Assist users more by providing better guidance e.g., should anomalies be raw numbers or percentages? • Provide a location where can download software to calculate areal means and anomalies from spatially heterogeneous data • And/or provide a standard dataset (e.g., ERA or NCEP/NCAR reanalysis) and tools to create regional values • A portal to national monitoring products??? • A climate monitoring lead centre???
BAMS: The Regional Climate chapter The elephant in the room… • There is no mention in the BAMS regional reports of quality of observations or MetaData… • How do we ensure that measurements are of the similar quality? • What level of Quality Control is acceptable? • Should this be described somewhere?
Thank you… Andrew Watkins +61-3-9669 4360 A.Watkins@bom.gov.au