Download
1 / 20
200 likes | 362 Views
Warm Up. The graph below represents Kim’s distance from home one day as she rode her bike to meet friends and to do a couple of errands for her mom before returning home . 1. Use the graph to describe Kim’s journey . 2. What do the horizontal lines on the graph represent?.

E N D
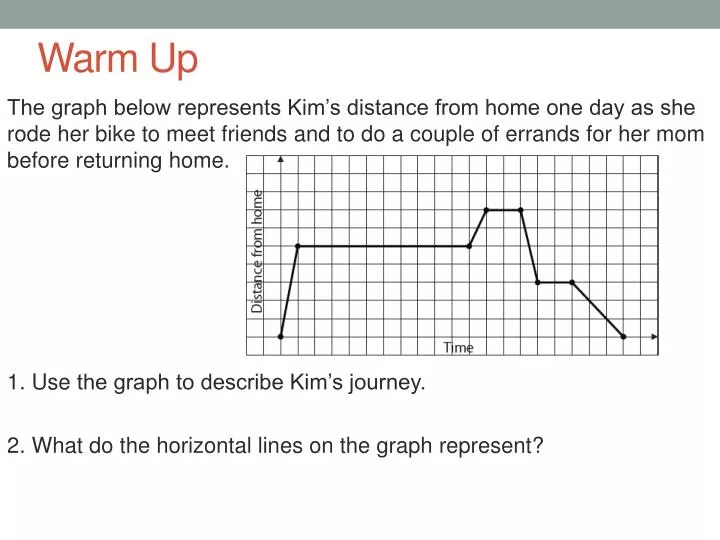
Warm Up The graph below represents Kim’s distance from home one day as she rode her bike to meet friends and to do a couple of errands for her mom before returning home. 1. Use the graph to describe Kim’s journey. 2. What do the horizontal lines on the graph represent?
Intercepts • Intercepts: where a function crosses the x-axis and y-axis • Y-Intercept: the point at which the graph crosses the y-axis and is written as (0, y) • X-Intercept: the point at which the graph crosses the x-axis and is written (x, 0)
Increasing and Decreasing • When determining whether intervals are increasing or decreasing, focus on the y-values. • Begin by reading the graph from left to right and notice what happens to the graphed line. • If the graph goes up from left to right, the function is increasing. • If the graph goes down from left to right, the function is decreasing. • A function is said to be constant if the graphed line is horizontal.
Positive/Negative • Interval: a continuous series of values • Continuous: has no “breaks” • A function is positive when its graph is above the x-axis. • A function is negative when its graph is below the x-axis. • Look at the x-intercepts of the function to determine where a function is positive/negative.
Extrema (Minimum/Maximum Points) • Relative Minimum: the point that is the lowest, or the y-value that is the least for a particular interval of a function • Relative Maximum: the point that is the highest, or the y-value that is the greatest for a particular interval of a function • Linear and exponential functions will only have a relative maximum or minimum if the domain is restricted.
Asymptote: a line that the graph gets closer and closer to but never crosses or touches
Type of function: Intercepts: Increasing/Decreasing: Positive/Negative: 1. A taxi company in Atlanta charges $2.75 per ride plus $1.50 for every mile driven. Determine the key features of this function.
Relative Min/Max: Domain: Range: Asymptotes: 1. A taxi company in Atlanta charges $2.75 per ride plus $1.50 for every mile driven. Determine the key features of this function.
2. A pendulum swings to 90% of its height on each swing and starts at a height of 80 cm. The height of the pendulum in centimeters, y, is recorded after x number of swings. Determine the key features of this function. Determine the key features of this function. Type of function: Intercepts: Increasing/Decreasing: Positive/Negative:
2. A pendulum swings to 90% of its height on each swing and starts at a height of 80 cm. The height of the pendulum in centimeters, y, is recorded after x number of swings. Determine the key features of this function. Determine the key features of this function. Relative Min/Max: Domain: Range: Asymptotes:
3. A ringtone company charges $15 a month plus $2 for each ringtone downloaded. Create a graph and then determine the key features of this function. Type of function: Intercepts: Increasing/Decreasing: Positive/Negative:
3. A ringtone company charges $15 a month plus $2 for each ringtone downloaded. Create a graph and then determine the key features of this function. Relative Min/Max: Domain: Range: Asymptotes:
4. There are many things to think about when purchasing a new car: year, make, model, included options, and price. As important as these considerations are, it is also important to consider the decreasing value of the car over time. Use the following key features to graph the value of a car over time: • The average price of a car in the United States is approximately $30,750. • The value decreases each year at an exponential rate and approaches the asymptote of y = 0. • The average car loses nearly half its original value after 5 years. For what values of x is the graph positive? What is the domain of this function? Identify the minimum and maximum of this graph.