Download
1 / 1
10 likes | 110 Views
Rapid Identification of Salmonella Subtypes by Optical Mapping Colin W Dykes 1 , Michael L. Kotewicz 2 , Noel Doheny 1 OpGen Inc. 708 Quince Orchard Road, Gaithersburg, MD 20878 1 , US Dept HHS, FDA, CFSAN, OARSA, Division of Molecular Biology, Laurel MD 20708 2. Background

E N D
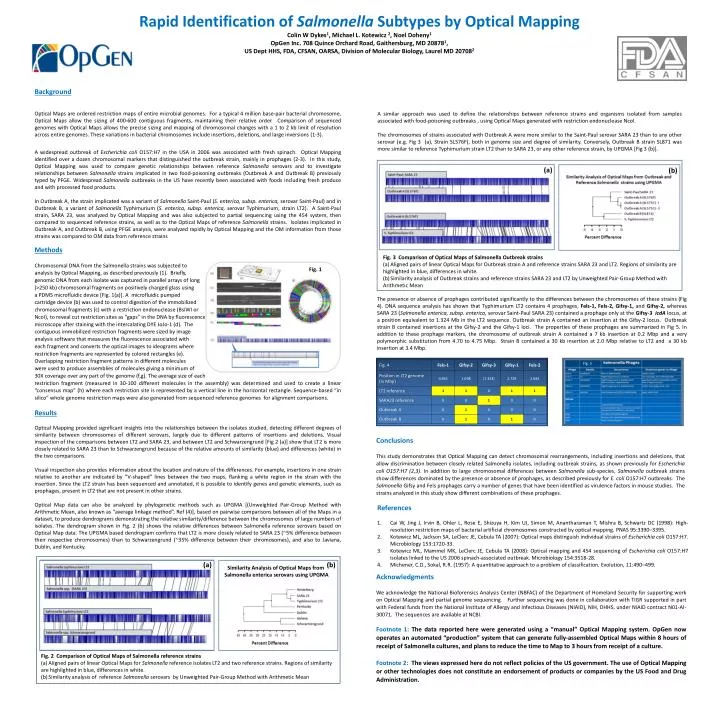
Rapid Identification of Salmonella Subtypes by Optical Mapping Colin W Dykes1, Michael L. Kotewicz 2, Noel Doheny1 OpGen Inc. 708 Quince Orchard Road, Gaithersburg, MD 208781, US Dept HHS, FDA, CFSAN, OARSA, Division of Molecular Biology, Laurel MD 207082 Background Optical Maps are ordered restriction maps of entire microbial genomes. For a typical 4 million base-pair bacterial chromosome, Optical Maps allow the sizing of 400-600 contiguous fragments, maintaining their relative order. Comparison of sequenced genomes with Optical Maps allows the precise sizing and mapping of chromosomal changes with a 1 to 2 kb limit of resolution across entire genomes. These variations in bacterial chromosomes include insertions, deletions, and large inversions (1-3). A widespread outbreak of Escherichia coli O157:H7 in the USA in 2006 was associated with fresh spinach. Optical Mapping identified over a dozen chromosomal markers that distinguished the outbreak strain, mainly in prophages (2-3). In this study, Optical Mapping was used to compare genetic relationships between reference Salmonella serovars and to investigate relationships between Salmonella strains implicated in two food-poisoning outbreaks (Outbreak A and Outbreak B) previously typed by PFGE. Widespread Salmonella outbreaks in the US have recently been associated with foods including fresh produce and with processed food products. In Outbreak A, the strain implicated was a variant of Salmonella Saint-Paul (S. enterica, subsp. enterica, serovarSaint-Paul) and in Outbreak B, a variant of Salmonella Typhimurium (S. enterica, subsp. enterica, serovarTyphimurium, strain LT2). A Saint-Paul strain, SARA 23, was analyzed by Optical Mapping and was also subjected to partial sequencing using the 454 system, then compared to sequenced reference strains, as well as to the Optical Maps of reference Salmonella strains. Isolates implicated in Outbreak A, and Outbreak B, using PFGE analysis, were analyzed rapidly by Optical Mapping and the OM information from those strains was compared to OM data from reference strains A similar approach was used to define the relationships between reference strains and organisms isolated from samples associated with food-poisoning outbreaks , using Optical Maps generated with restriction endonuclease NcoI. The chromosomes of strains associated with Outbreak A were more similar to the Saint-Paul serovar SARA 23 than to any other serovar (e.g. Fig 3 (a), Strain SL576F), both in genome size and degree of similarity. Conversely, Outbreak B strain SL871 was more similar to reference Typhimurium strain LT2 than to SARA 23, or any other reference strain, by UPGMA [Fig 3 (b)]. (a) (b) Fig. 1 Methods Chromosomal DNA from the Salmonella strains was subjected to analysis by Optical Mapping, as described previously (1). Briefly, genomic DNA from each isolate was captured in parallel arrays of long (>250 kb) chromosomal fragments on positively charged glass using a PDMS microfluidic device [Fig. 1(a)]. A microfluidic pumped cartridge device (b) was used to control digestion of the immobilized chromosomal fragments (c) with a restriction endonuclease (BsiWI or NcoI), to reveal cut restriction sites as “gaps” in the DNA by fluorescence microscopy after staining with the intercalating DYE JoJo-1 (d). The contiguous immobilized restriction fragments were sized by image analysis software that measures the fluorescence associated with each fragment and converts the optical images to ideograms where restriction fragments are represented by colored rectangles (e). Overlapping restriction fragment patterns in different molecules were used to produce assemblies of molecules giving a minimum of 30X coverage over any part of the genome (f,g). The average size of each restriction fragment (measured in 30-100 different molecules in the assembly) was determined and used to create a linear “consensus map” (h) where each restriction site is represented by a vertical line in the horizontal rectangle. Sequence-based “in silico” whole genome restriction maps were also generated from sequenced reference genomes for alignment comparisons. Fig. 3 Comparison of Optical Maps of Salmonella Outbreak strains Aligned pairs of linear Optical Maps for Outbreak strain A and reference strains SARA 23 and LT2. Regions of similarity are highlighted in blue, differences in white. Similarity analysis of Outbreak strains and reference strains SARA 23 and LT2 by Unweighted Pair-Group Method with Arithmetic Mean The presence or absence of prophages contributed significantly to the differences between the chromosomes of these strains (Fig 4). DNA sequence analysis has shown that Typhimurium LT2 contains 4 prophages, Fels-1, Fels-2, Gifsy-1, and Gifsy-2, whereas SARA 23 (Salmonella enterica, subsp. enterica, serovar Saint-Paul SARA 23) contained a prophage only at the Gifsy-3 icdA locus, at a position equivalent to 1.324 Mb in the LT2 sequence. Outbreak strain A contained an insertion at the Gifsy-2 locus. Outbreak strain B contained insertions at the Gifsy-2 and the Gifsy-1 loci. The properties of these prophages are summarized in Fig 5. In addition to these prophage markers, the chromosome of outbreak strain A contained a 7 kb insertion at 0.2 Mbp and a very polymorphic substitution from 4.70 to 4.75 Mbp. Strain B contained a 30 kb insertion at 2.0 Mbp relative to LT2 and a 30 kb insertion at 3.4 Mbp. Fig. 5 Results Optical Mapping provided significant insights into the relationships between the isolates studied, detecting different degrees of similarity between chromosomes of different serovars, largely due to different patterns of insertions and deletions. Visual inspection of the comparisons between LT2 and SARA 23, and between LT2 and Schwarzengrund [Fig 2 (a)] show that LT2 is more closely related to SARA 23 than to Schwarzengrund because of the relative amounts of similarity (blue) and differences (white) in the two comparisons. Visual inspection also provides information about the location and nature of the differences. For example, insertions in one strain relative to another are indicated by “V-shaped” lines between the two maps, flanking a white region in the strain with the insertion. Since the LT2 strain has been sequenced and annotated, it is possible to identify genes and genetic elements, such as prophages, present in LT2 that are not present in other strains. Optical Map data can also be analyzed by phylogenetic methods such as UPGMA [(Unweighted Pair-Group Method with Arithmetic Mean, also known as “average linkage method”, Ref (4)], based on pairwise comparisons between all of the Maps in a dataset, to produce dendrograms demonstrating the relative similarity/difference between the chromosomes of large numbers of isolates. The dendrogram shown in Fig. 2 (b) shows the relative differences between Salmonella reference serovars based on Optical Map data. The UPGMA based dendrogram confirms that LT2 is more closely related to SARA 23 (~5% difference between their respective chromosomes) than to Schwarzengrund (~35% difference between their chromosomes), and also to Javiana, Dublin, and Kentucky. Conclusions This study demonstrates that Optical Mapping can detect chromosomal rearrangements, including insertions and deletions, that allow discrimination between closely related Salmonella isolates, including outbreak strains, as shown previously for Escherichia coli O157:H7 (2,3). In addition to large chromosomal differences between Salmonella sub-species, Salmonella outbreak strains show differences dominated by the presence or absence of prophages, as described previously for E. coli O157:H7 outbreaks. The Salmonella Gifsy and Fels prophages carry a number of genes that have been identified as virulence factors in mouse studies. The strains analyzed in this study show different combinations of these prophages. Similarity Analysis of Optical Maps from Salmonella enterica serovars using UPGMA • References • 1. Cai W, Jing J, Irvin B, Ohler L, Rose E, Shizuya H, Kim UJ, Simon M, Anantharaman T, Mishra B, Schwartz DC (1998): High-resolution restriction maps of bacterial artificial chromosomes constructed by optical mapping. PNAS 95:3390–3395. • 2. Kotewicz ML, Jackson SA, LeClerc JE, Cebula TA (2007): Optical maps distinguish individual strains of Escherichia coli O157:H7. Microbiology 153:1720-33. • Kotewicz ML, Mammel MK, LeClerc JE, Cebula TA (2008): Optical mapping and 454 sequencing of Escherichia coli O157:H7 isolates linked to the US 2006 spinach-associated outbreak. Microbiology 154:3518-28. • Michener, C.D., Sokal, R.R. (1957): A quantitative approach to a problem of classification. Evolution, 11:490–499. Fig. 2 Comparison of Optical Maps of Salmonella reference strains Aligned pairs of linear Optical Maps for Salmonella reference isolates LT2 and two reference strains. Regions of similarity are highlighted in blue, differences in white. Similarity analysis of reference Salmonella serovars by Unweighted Pair-Group Method with Arithmetic Mean (a) (b) Acknowledgments We acknowledge the National Bioforensics Analysis Center (NBFAC) of the Department of Homeland Security for supporting work on Optical Mapping and partial genome sequencing. Further sequencing was done in collaboration with TIGR supported in part with Federal funds from the National Institute of Allergy and Infectious Diseases (NIAID), NIH, DHHS, under NIAID contract N01-AI-30071. The sequences are available at NCBI. Footnote 1: The data reported here were generated using a “manual” Optical Mapping system. OpGen now operates an automated “production” system that can generate fully-assembled Optical Maps within 8 hours of receipt of Salmonella cultures, and plans to reduce the time to Map to 3 hours from receipt of a culture. Footnote 2: The views expressed here do not reflect policies of the US government. The use of Optical Mapping or other technologies does not constitute an endorsement of products or companies by the US Food and Drug Administration.