Download
1 / 33
330 likes | 452 Views
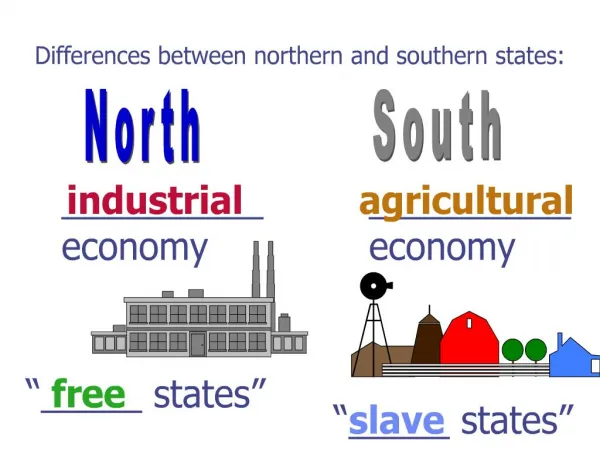
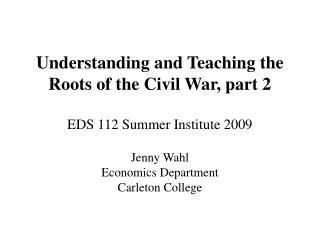
Understanding and Teaching the Roots of the Civil War EDS 112 Summer Institute 2009. Jenny Wahl Economics Department Carleton College. Influence of Regional Portfolio Composition. Land use Population density Urbanization Farm size Production process (output = f[asset inputs])

E N D
Understanding and Teaching the Roots of the Civil WarEDS 112 Summer Institute 2009 Jenny Wahl Economics Department Carleton College
Influence of Regional Portfolio Composition Land use Population density Urbanization Farm size Production process (output = f[asset inputs]) Output mix Types of agricultural products Agriculture vs. manufacturing Home consumption, domestic market, exports Generation and use of public funds Land sales vs. tariffs Internal improvements Transportation regimes Credit and banking institutions Asset Composition Land (immobile) Physical capital (partly mobile) Slaves (generally mobile) Free human capital (mobile) Climate (immobile)
price price Sservants Sservants Sslaves Sslaves D0 D0 D1 D1 Unskilled labor Skilled labor The Shift from Indentured Servants to Slaves
Distribution of Population (1790, 1830,1860) and Land Mass Note: Northeast= New England and MidAtlantic, South includes Texas and Oklahoma but not Missouri, West includes Midwest, Plains, Mountain, and Pacific. Sources: http://fisher.lib.virginia.edu/collections/stats/histcensus/php/state.php; http://en.wikipedia.org/wiki/List_of_U.S._states_by_area
Distribution of Population (1860) and Land Mass, Part 2 • Population (1860) • Slaveholding states had 38% of the total population • Slaveholding states had 29% of the total white population • Border states had 1/3 of the white population in slaveholding states • Land Mass • Territories 49% • North 23% • South 23% • Border 5% Sources:http://fisher.lib.virginia.edu/collections/stats/histcensus/php/state.php; http://en.wikipedia.org/wiki/List_of_U.S._states_by_area
Population per square mile, 1850 and 1860, selected states Source: U.S. Bureau of the Census, Historical Statistics Series A-196 (reported in Gavin Wright, Political Economy of the Cotton South)
Percentage of Population in Urban Area, by Region (1790, 1830, 1860) Note: Northeast= New England and MidAtlantic, South includes Texas and Oklahoma but not Missouri, West includes Midwest, Plains, Mountain, and Pacific. Source: Tab Aa36-92, Historical Statistics of the U.S., Millennial Edition online.
Urban Population, 1860 Source: 1860 US Census, reprinted in Roger Ransom entry, Historical Statistics Millennial edition online.
Location of Foreign-Born, 1860 North -- 86% NY – 24.4% PA – 10.5% OH, IL – 8% each WI – 7% MA – 6% South --13% Border states of MO, MD, and KY -- 7.3% LA – 2% TX – 1% Source: U.S. Census, 1860.
Improved Acreage and Value of Implements per Worker by Region, 1860
Source: Gavin Wright, Capitalism and Slavery on the Islands: A Lesson from the Mainland, 17 J. Interdisc. Hist. 851 (1987).
Distribution of Slave Population by State, 1860 Source: Table Bb209-214, Historical Statistics; fisher.uva census browser.
Total Value of U.S. Slaves, 1810-1860 Source: Ransom and Sutch, Capitalists without Capital.
2000 1800 1600 1400 dollars 1200 1000 800 sales price appraised value 600 400 1843 1844 1845 1846 1847 1848 1849 1850 1851 1852 1853 1854 1855 1856 1857 1858 1859 1860 year Average Value, U.S. Prime Male Slaves, 1843-1860 Source:Robert Fogel and Stanley Engerman. Slave Sales and Appraisals, 1775-1865 [Computer file]. ICPSR07421-v3. Rochester, NY: University of Rochester [producer], 1976.
Productivity of Southern Farms Relative to Northern Farms, 1860
Slave Ownership in the South Percentage of families owning slaves: 1830 – 36% 1850 – 31% 1860 – 25% (half owned fewer than 5, 90% owned fewer than 20, only 0.2% held 100 or more slaves) Percentage of farm owner-operators owning no slaves: 1850 – fewer than 40% 1860 – about 50% Sources: Gavin Wright, Political Economy of the Cotton South; Porter, Encyclopedia.
Importance of Manufacturing by Region, 1860 Source: 8th and 9th Census of Mfrs,cited in Wright Pol Econ of Cotton South 1978
Value Added in Manufacturing per Capita, 1850 and 1860, Southern States
Cotton and Slaves,1805-1860 (output/slave, slave price, cotton export price)
Trade in Manufactures and Cotton, 1830-1860 Source: Historical Stats; tables Ee569-589 and Ee446-457
Some Summary Stats by Region, 1860 Sources: Easterlin 1961, Bateman and Weiss, Fishlow – reported in Lindstrom, Dom Trade, Am Ec Hist Encyclo