Download
1 / 7
80 likes | 230 Views
Methodology for Demand Forecasts for Bandera Electric Cooperative, Inc. Brian D. Bartos, P.E. Manager, Engineering Presented to ERCOT Reliability & Operations Subcommittee June 10, 2010. General Overview of Forecasting at BEC.

E N D
Methodology forDemand Forecasts for Bandera Electric Cooperative, Inc. Brian D. Bartos, P.E. Manager, Engineering Presented to ERCOT Reliability & Operations Subcommittee June 10, 2010
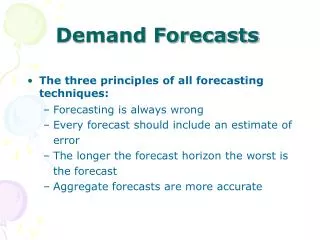
General Overview of Forecasting at BEC • Forecasts are prepared by BEC staff using the best available information. • In rare cases, data has to be estimated • These forecasts are provided to both ERCOT and LCRA as required. • ERCOT utilizes this data in their overall load forecasts and reserve margin calculation • LCRA utilizes this data in their planning process • The criteria used to determine the validity of each forecast is: • “Is the forecast reasonable and supportable”. Presentation to ERCOT ROS -- June 10, 2010
Methodology • Review past historical non-coincident data for each substation transformer. • Factor out any load which may have been abnormally configured or step-loads. • Using the past six (6) years of historical data, perform a weighted average least squares linear projection to determine slope (growth rate). • Apply growth rate to previous year peak demand. • If growth calculates negative, hold the load at previous year value. Presentation to ERCOT ROS -- June 10, 2010
1,969 A Cooling Degree Day is a unit used to relate the day's temperature to the energy demands of air conditioning. Cooling Degree Days are calculated by subtracting 65 from a day's average temperature. Cooling Degree Days can be used to compare the current summer to past summers. It can also be used to compare the heat in one part of the country with another. 1,890 1,870 1,840 Cooling Degree Days (June-Sept) “Hotter Than Normal” 37 Year Average: 1,691 “Cooler Than Normal” 1,630 1,623 1,572 1,549 Source: Boerne NOAA Weather Station Year Forecast Adjustments • Make adjustments to account for block load additions or other load transfers. • Make adjustments due to past weather conditions. • Look at Cooling Degree Days / Heating Degree Days Presentation to ERCOT ROS -- June 10, 2010
Summer & WinterNon-Coincident Peak Demand Winter Baseline Projected Increase of 6,706 kW of Non-Coincident Demand per Year or 4.2% growth compared to 5.0% a year ago. Summer Baseline Projected Increase of 3,794 kW of Non-Coincident Demand per Year or 3.1% growth compared to 4.9% a year ago. Severe Weather, Strong Economy 192,094 178,681 165,269 163,474 Historical 158,563 143,804 Non-Coincident Demand (kW) 136,215 132,421 127,497 124,833 120,657 131,388 Mild Weather, Slower Economy 121,035 115,927 Projected Year Presentation to ERCOT ROS -- June 10, 2010
Verification by Member Class • To help verify the forecasts, BEC determines a forecast for: • Coincident Peak (summer / winter) • Member classes • Total Meters • Total Energy • The criteria used to determine the validity of each forecast is: • “Is the forecast reasonable and supportable” Presentation to ERCOT ROS -- June 10, 2010
QUESTIONS Presentation to ERCOT ROS -- June 10, 2010