Download
1 / 14
140 likes | 140 Views
This study focuses on the detection and adjustment of abnormal test-day yields in dairy cows. It investigates the impact of including abnormal yields on yield estimation accuracy and proposes a method to adjust these abnormal yields. The study also evaluates the effect of the adjustment on the correlation between consecutive lactations. The findings suggest that adjusting abnormal yields can improve yield estimation accuracy and enhance the similarity between lactations.

E N D
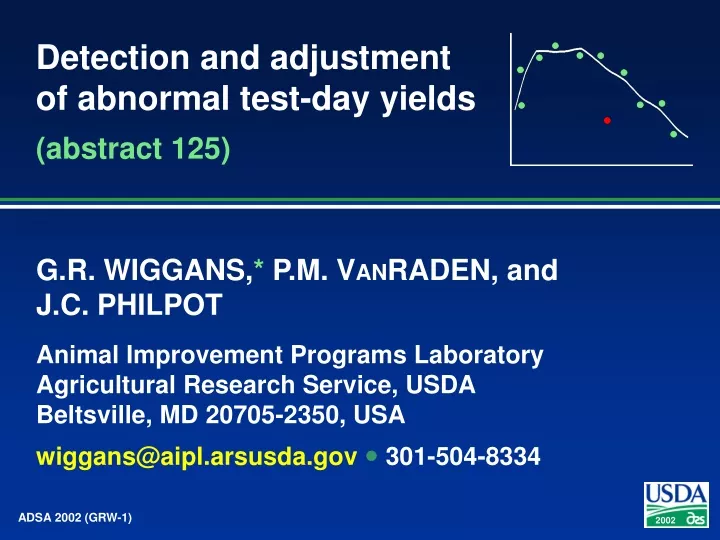
Detection and adjustment of abnormal test-day yields (abstract 125) G.R. WIGGANS,* P.M. VANRADEN, and J.C. PHILPOT Animal Improvement Programs Laboratory Agricultural Research Service, USDA Beltsville, MD 20705-2350, USA wiggans@aipl.arsusda.gov 301-504-8334
Estimation of lactation yields • Inclusion of abnormal yields may reduce accuracy • Cow may be reported as sick on test day • ICAR procedures exclude sick tests below a threshold
Calculation of lactation records • Best prediction used since February 1999 for calvings during 1997 or later • All sick tests have been excluded: • Many sick tests with milk yields >45 kg • Sick coding varies by herd and dairy records processing center • No check for abnormally high test-day yield compared with cow's other test days
Objectives • Check every test for abnormal yield (not just those coded as sick) • Detect abnormally high or low test yields by comparison with yield from adjacent test days • Define approximately 1% of each tail of the distribution as abnormal • Adjust test-day yield to floor or ceiling
Methods • Calculate predicted yield • Compare test-day yield with thresholds • Upper: 150% of predicted yield • Lower: 60% of predicted yield • If test-day yield detected to be abnormal, recalculate predicted yield based on yield from adjacent test days
Methods (continued) • If test-day yield still detected to be abnormal, adjust to threshold • Calculate lactation yields using best prediction with adjusted test-day yields
Predicted yield calculation • For first test day: predicted yield = following yield – slope (interval) • For second test day and later: predicted yield = previous yield + slope (interval)
Predicted yield calculation(continued) • Slope is function of DIM, DIM2, test-day yield, and interaction • Coefficients differ by • Test day (first vs. second and later) • Trait (milk, fat, protein) • Parity (1, 2, 3+) • DIM group (5-49, 50+) to account for peak yield • Previously identified abnormal yields not used • Sick tests with milk yields of <4.5 kg ignored
Abnormal yield detected • Predicted yield recalculated by interpolating between adjacent test days • If test-day yield still detected as abnormal, predicted yield recalculated again using second test day after outlier • Herd average used when only 2 test days available
Component percentage limits • Detection of abnormal fat and protein yields based on weight (not percentage) • Unlikely component percentages possible • Component percentage limits: • Fat: 2-7% and herd mean – 1% to herd mean + 2% • Protein: 2-5% and herd mean – 1% to herd mean + 1.5%
Outlier results • Calvings during 1997 or later • Among >93 million test-day records, abnormal yields found: • Milk: 1.8% • Fat: 3.4% • Protein: 1.9%
Improved accuracy? • Correlations of lactations with 1 adjusted outlier with following lactation: • Adjustment of abnormal yields should increase similarity between consecutive lactations
August 2002 implementation • Lactation records for calvings during 1997 or later recalculated • Adjusted yields shown on industry web queries of test-day data • Additional data may cause change in status of detected outlier and adjusted yield
Summary • All test-day yields evaluated as potential outliers (not just sick tests) • Improved accuracy in estimation of expected yield • Floor or ceiling (instead of deletion) for abnormal yields to reflect actual yield better • Improved correlation between consecutive lactations with outlier adjustment