Download
1 / 7
70 likes | 78 Views
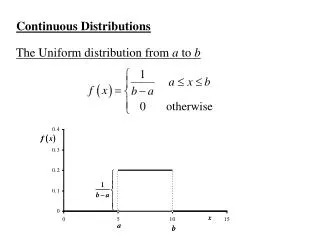
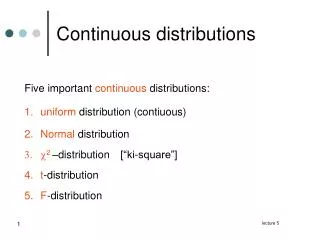
Set 3a. Continuous distributions Student- t and F distributions. Student- t distribution. One parameter, degrees of freedom df = 1, 2, 3, . . . Symmetric, median=mode=0 Mean=0, for df > 1 Variance for df > 2. Black, Z. Dotted (Red) t, df=10. Dashed (Blue) t, df=3.

E N D
Set 3a Continuous distributions Student-t and F distributions
Student-t distribution • One parameter, degrees of freedom • df = 1, 2, 3, . . . • Symmetric, median=mode=0 • Mean=0, for df > 1 • Variance for df > 2 Black, Z Dotted (Red) t, df=10 Dashed (Blue) t, df=3 When df is large, t is approximately normal
t table • Example: Upper percentile table • Upper tail probability p=a (Column label) • df(Row label) • Entries are t valuecorresponding to dfandupper tail probability a df = 3 df .05 a .95 ta t = 2.353
MINITAB computation • MINITAB • CALC >> Probability distributions >> T >> Degrees of freedom >> Input constant • Cumulative probability gives area to the left of a given value x • Example:Compute P(T<1.91) for t distributionwith df=3 Student's t distribution with 3 DF x P( X <= x ) 1.91 0.923937 • Inverse cumulative gives the percentile • Example:Compute the 97.5th percentile of t distributionwith df=3 Student's t distribution with 3 DF P( X <= x ) x 0. 9750 3.12845
Middle interval • Upper tail probability a = p/2 • Example: Findtvalues for middle 95% interval when Degrees of freedom df= 3 df = 3 .025 .025 .95 t = -3.182 t = 3.182
F Table • Example: Upper 5 percentile table • df1 = 7(Column label) • df2 = 30 (Row label) From table 0.05 2.33
MINITAB computation • MINITAB • CALC >> Probability distributions >> F >> Numerator degrees of freedom >> Denominator degrees of freedom >> Input constant • Cumulative probability gives area to the left of a given value x • Example:Compute P(F<5.25) for F distributionwith df1 =2, df2 =25 F distribution with 2 DF in numerator and 25 DF in denominator x P( X <= x ) 5.25 0.987515 • Inverse cumulative gives the percentile • Example:Compute the 90th percentile of t distributionwith df=2 F distribution with 2 DF in numerator and 25 DF in denominator P( X <= x ) x 0. 9 2.52831