Download
1 / 7
70 likes | 191 Views
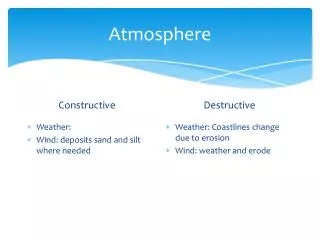
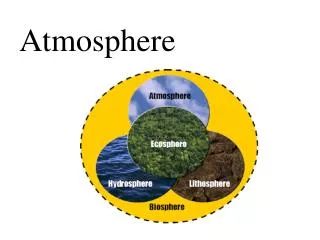
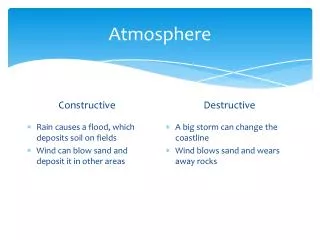
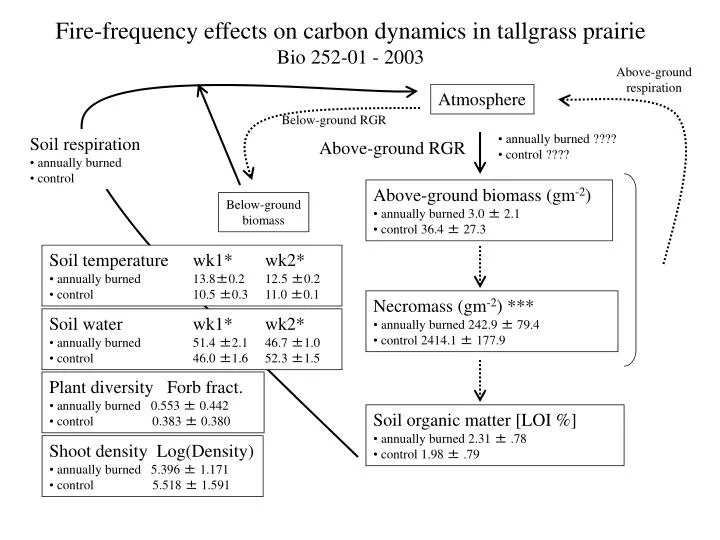
Fire-frequency effects on carbon dynamics in tallgrass prairie Bio 252-01 - 2003. Above-ground respiration. Atmosphere. Below-ground RGR. annually burned ???? control ????. Soil respiration annually burned control. Above-ground RGR. Above-ground biomass (gm -2 )

E N D
Fire-frequency effects on carbon dynamics in tallgrass prairie Bio 252-01 - 2003 Above-ground respiration Atmosphere Below-ground RGR • annually burned ???? • control ???? • Soil respiration • annually burned • control Above-ground RGR • Above-ground biomass (gm-2) • annually burned 3.0 ± 2.1 • control 36.4 ± 27.3 Below-ground biomass • Soil temperature wk1* wk2* • annually burned 13.8±0.2 12.5 ±0.2 • control 10.5 ±0.3 11.0 ±0.1 • Necromass (gm-2) *** • annually burned 242.9 ± 79.4 • control 2414.1 ± 177.9 • Soil water wk1* wk2* • annually burned 51.4 ±2.1 46.7 ±1.0 • control 46.0 ±1.6 52.3 ±1.5 • Plant diversity Forb fract. • annually burned 0.553 ± 0.442 • control 0.383 ± 0.380 • Soil organic matter [LOI %] • annually burned 2.31 ± .78 • control 1.98 ± .79 • Shoot density Log(Density) • annually burned 5.396 ± 1.171 • control 5.518 ± 1.591
Fire-frequency effects on carbon dynamics in tallgrass prairie Bio 252(Brown) - 2008 Above-ground respiration Atmosphere • Soil respiration (g/m2/hr) • annually burned 1.3 ± 0.6 • control 1.7 ± 0.9 Below-ground RGR • annually burned ???? • control ???? Above-ground RGR • Above-ground biomass (g/ m2) *** • annually burned 4.6 ± 1.4 • control 20.5 ± 3.4 • Below-ground biomass (g/m2) • annually burned 490 ± 165 • control 497 ± 115 • Soil temperature *** • annually burned 14.3±0.2 • control 10.7 ±0.2 • Necromass (g/m2) *** • annually burned 73.6 ± 24 • control 624 ± 83.2 • Soil water *** • annually burned 27.4 ±0.7 • control 30.7 ±0.5 • Plant diversity Forb fract. • annually burned 0.23 ± .06 • control 0.44 ± .13 • Soil organic matter [LOI %] • annually burned • control • Shoot density stems/m2 • annually burned 133 ± 21 • control 124 ± 21
Bowman, O’Brien and Vaughan 2007 Grass Biomass Fig 3: Grass biomass is significantly higher in burned than unburned prairie plots. (p=.006) Bars are one standard deviation from the mean.
Bowman, O’Brien and Vaughan 2007 Forbs Fig. 1: Forbs biomass is not significantly different between burned and unburned plots. (p=0.853) Bars are one standard error from the mean.
Bowman, O’Brien and Vaughan 2007 Necromass Fig 2: The mean of necromass in unburned plots is slightly higher than in burned plots, however the results are non-significant (p=0.412) Bars are one standard deviation from the mean.
Results Big Bluestem is strongly affected by recent burning, while Indian Grass is not. Bars are one standard error from the mean. Davenport and Cohn 2007