Download
1 / 25
250 likes | 264 Views
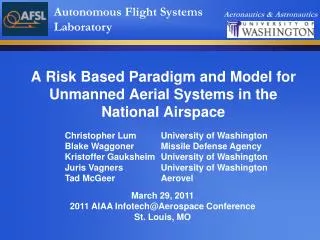
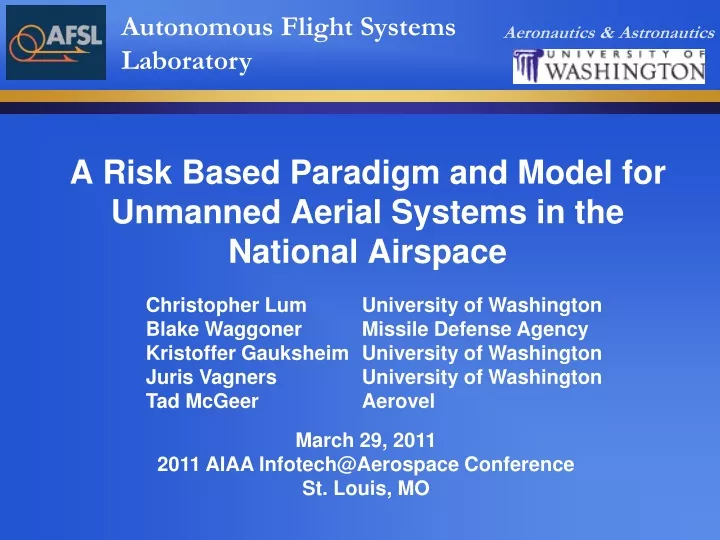
A Risk Based Paradigm and Model for Unmanned Aerial Systems in the National Airspace. Christopher Lum University of Washington Blake Waggoner Missile Defense Agency Kristoffer Gauksheim University of Washington Juris Vagners University of Washington Tad McGeer Aerovel. March 29, 2011

E N D
A Risk Based Paradigm and Model for Unmanned Aerial Systems in the National Airspace Christopher Lum University of Washington Blake Waggoner Missile Defense Agency Kristoffer Gauksheim University of Washington Juris Vagners University of Washington Tad McGeer Aerovel March 29, 2011 2011 AIAA Infotech@Aerospace Conference St. Louis, MO
Autonomous Flight Systems Laboratory People • Juris Vagners • Kristi Morgansen • Uy-Loi Ly • Christopher Lum • Rolf Rysdyk • Kristoffer Gauksheim • Amy Arbeit • Blake Waggoner • Esther Anderson Mission Statement • To conduct research that advances navigation, guidance and control (GN&C) technology relevant to unmanned vehicles. University of Washington
Motivation State of Affairs • FAA policy is very restrictive to UAS operations but… • “The FAA supports UA flight activities that can demonstrate that the proposed operations can be conducted at an acceptable level of safety.” • -Memorandum AFS-400 UAS Policy 05-01 Challenges • FAA must ensure UAS operate at same level of safety as manned aircraft • Major issues • Less reliable • “See and Avoid” becomes “Sense and Avoid” • Communication link liability University of Washington
Goals Motivation • “Acceptable system safety studies must include a hazard analysis, risk assessment, and other appropriate documentation that supports the ‘extremely improbable’ determination.” Goals • Develop a user friendly tool for risk assessment. • Tool should be mission specific. • Analysis should be based on a simple, understandable model. • Tool should be easily accessible and easy to use (web implementation) University of Washington
Deviation from Manned Paradigm Traditional Aircraft Safety People aboard primary aircraft People aboard other aircraft People on the ground • If group 1 safety is assured, group 2 and 3’s safety follows. • Aircraft must be reliable regardless of operating area. • With UAS, safety of primary aircraft is irrelevant. • Safety is a function of operational area of UAS. University of Washington
Risk Assessment Goals Effects of UAS Failures SECONDARY CONCERNS Cost to repair damage Cost to replace aircraft Environmental impact Injuries Lawsuits Negative publicity LOSS OF HUMAN LIFE University of Washington
Risk Framework Assumptions • Cruise phase of flight only (takeoff/landing in controlled or restricted areas) • Allow for multiple operating areas models • Allow for transient aircraft models • Failures such as engine cut-off, structural failure, etc. are all grouped into a general failure rate. Measured experimentally. University of Washington
Risk Assessment Transient aircraft densities Number of agents in team Collision avoidance Mean time between failures Number of agents in team Midair Collisions (transient & in-fleet) General Failure AC dimensions Ped dimensions Bldg dimensions Ped density Bldg density Pedestrian Strikes Building Strikes Pedestrian Strikes Building Strikes Ped susceptability Bldg protection Mission length Fatalities Fatalities Total Fatalities and Liability Insurance Cost University of Washington
Midair Collision Model • User inputs densities of transient aircraft and number of agents in team. • UA and transient aircraft recast as circles of equivalent cross sectional area. • Unmitigated collision rate based on random collision theory (Maxwell model) Transient AC density from Flight Explorer PE University of Washington
Midair Collision Model • Define collision avoidance factor for a party as percentage of time an otherwise imminent collision is avoided by that party alone. Imminent Collision UA Transient AC 1 - • Both transient and UA system must fail for collision to occur. Transient AC System Fails UA System Fails Transient AC System Works UA System Works Collision rate b/w transient AC and UA 1 - Collision rate b/w UA within team University of Washington
Structured Airspaces • Can this model be modified for more structured airspaces such as near airports and other air corridors? • Apply evolutionary algorithm, data mining, and regression combo approach. • Use Eureqa analysis toolkit. • Rapidly identify function from data to suggest underlying models of the physical process. Eureqa tool by Schmidt and Lipson University of Washington
Model Validation • Compare in-fleet collision avoidance model with historical data. • Simple model provides surprisingly accurate, order of magnitude results • Historically, pilots avoid ~14% of imminent collisions. University of Washington
Ground Strikes • Surface collisions • Lethal areas depending on failure type. • Midair collisions yield vertical crash. • General system failure yields horizontal, gliding crash. University of Washington
Ground Strikes • Expected strike rate based on pedestrians/buildings density and dimensions and also aircraft dimensions. Strike rate due to general system failures Strike rate due to midair collisions (transient and in-fleet) Gas based midair collision model Large aircraft in densely populated area, high fatalities Small aircraft in sparse area, low fatalities University of Washington
Fatalities and Insurance • Fatalities in midair collisions based on passenger load of transient AC. • Fatalities from ground strikes based on UAS & building properties. Unprotected structure Protected structure US Army correlation b/w kinetic energy & lethality Total fatality rate General system failures Midair collisions • May be easier to visualize cost of liability insurance for operation by assuming insurance payment per fatality (ie $10M/fatality) University of Washington
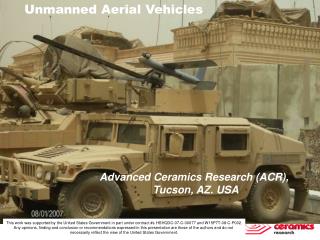
Example: Border Patrol • “Customs and Border Protection has said it intends to increase unmanned aircraft systems across the country this year, and it expects a complete network of unmanned planes all along the border by 2015.” • -Tim Eaton, American-Statesman • Customs and Border Protection currently use MQ-9 Reaper to monitor Arizona-Mexico border. • 3 aircraft in air, 24 hours a day for a year. • Flying over populated and spare areas with transient aircraft in airspace. Is this operation safe? University of Washington
Example: Border Patrol • UAS properties • Frontal area = 18.5 m2 • Velocity = 162 knots • L/D = 25:1 → glide angle 2.3o • Class A mishap rate of 15.3/100,000 flight hours → λ = 1.53E-4 • Reliable in-fleet collision avoidance → εua/ua = 0.9 • Equipped with Mode C transponders → εua/o = 0.7 Frontal area approximation University of Washington
Example: Border Patrol • Operating Area • 600 km long, 20 km wide area → Aops = 12,000 km2 • Population and building density from US Census Bureau and ZIP codes along border. Excludes 3 biggest cities on border (neglect 7% of area but exclude 48% of population). σb = 1.4 buildings/km2, σp = 0.26 people/km2 • Due to size and speed, lethal to pedestrian → Dped = 1 fatality/strike • Buildings offer some protection → Dbldg = 0.42 fatality/strike • 3 UAS flying year round, ML = 8760 hours University of Washington
Example: Border Patrol • Transient Aircraft • Density determined by polling Flight Explorer PE in region of interest → 4.167E-6 AC/km3 • Assume only regional jets in area • Velocity = 432 knots • Frontal Area = 80 m2 • Passenger load = 45 people/AC • AC under ATC control → εo = 0.95 • Insurance • Assume $10M liability per fatality Transient AC traffic in area of interest from Flight Explorer PE University of Washington
Example: Border Patrol • Results • Ftransient = 6.03E-9 collisions/hr ↔ 1 collision every ≈19,000 missions • Ffleet = 1.11E-11 collision/hr ↔ 1 in fleet every ≈1,000 missions • Ffat,p = 1.51E-6 fatalities/hr ↔ 1 fatality due to general system failure every 75 missions • Ffat,midair = 2.72E-7 fatalities/hr ↔ 1 fatality due to midair collision (both transient and in-fleet) every 420 missions • M = $17.85/hr ↔ ≈$150K to insure per mission • Interpretation • General system failures are a much bigger threat than mid air collisions. • If flying manned aircraft with equivalent reliability, expect 4 crashes and pilot fatalities. This is a good example of UAS being an effective replacement. System failure led to first crash in April 2006, no injuries University of Washington
Example: Urban Applications • Use UAS to monitor activities around city • Traffic monitoring • Harbor patrol • Law enforcement assistance • Persistent Surveillance Is this operation safe? University of Washington
Example: Urban Applications • UAS Properties • 4 MLB BAT UAS, 24 hr/day for 1 year. • Operating Area • Mixture of land and marine environments in Seattle, WA (multiple operating areas). • Boats modeled as buildings • Transient Aircraft • Mixture of general aviation, regional, and commercial (multiple transient AC models) University of Washington
Example: Urban Applications • Results • Likely to strike pedestrians and buildings (significant secondary economic impact) • Ground based fatality is virtually guaranteed during a mission. • Ground based operation area is much more dangerous than maritime environment (maritime is still prohibitively costly >$1M per mission) University of Washington
Web Based Implementation • Easy to use system to acquaint people with “risk based paradigm” • Website helps users find information and perform calculations. http://vger.aa.washington.edu/~afsl University of Washington
Conclusions • Risk tool presented here is designed to be a reliable, accurate, and easily accessible method to estimate the risk to human life incurred from a given UAS operation. • Risk to human life is primary concern, economic impacts can be derived as secondary parameters. • Currently, tool is best used as an order of magnitude approximation due to large uncertainty in input parameters. • Estimates could be used to make a case to the FAA for safe operation of UAS in the National Airspace. QUESTIONS? University of Washington