Download
1 / 34
340 likes | 452 Views
Voters’ Education and Electoral Participation: Barabanki (U.P.) SC 53 Focus : Women Empowerment. Representing the District Team Ministhy S. D E O Barabanki, Uttar Pradesh, 2014, Lok Sabha Elections. The Elections and the Women: A historical perspective.

E N D
Voters’ Education and Electoral Participation: Barabanki (U.P.) SC 53 Focus : Women Empowerment Representing the District Team Ministhy S. D E O Barabanki, Uttar Pradesh, 2014, Lok Sabha Elections
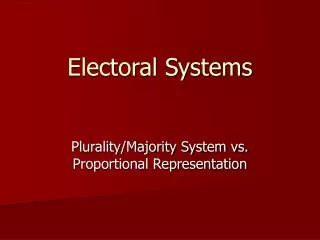
The Elections and the Women: A historical perspective • Women and Elections: International Women Suffrage • In Pre 1950 India • The right of women to vote and stand as Candidate : 1947 • In Post 1950 India, The article 14 of the Constitution of India empowered all by proclaiming equality for all
The First Few General Elections in India • The data is not available with respect to male-female Voters for first general elections. Not even for next 3 more of 1957, 1962, 1967 ! • Only from 1971 elections male female vote % is available
Barabanki Status of Women • Suffering from some of the worst development indicators of female empowerment • Maternal mortality rate • Infant mortality rate • Toilet facilities for women
Basic Analysis of Women Participation in Elections • 2009 Parliamentary Election : • 52.3% Total voter turnout • 44.7 % Women voter turnout The worst voter turnout Ass. Constituency in P E 2009 : Haidergarh - 46.37% Total voter turnout, - 39.96 % Women voter turnout The best voter turnout Ass. Constituency in P E 2009 : Kursi - 56.39% Total voter turnout, - 49.32 % Women voter turnout • 2012 Assembly Elections : Gender Ratio 843 Women voters enrolled for every 1000 Male voters (Extremely low against desirable statics of 908)
District Team’s Strategy for 2014 Par. Elections • Pull up Gender Ratio – Enroll maximum women voters • Analyze within each AC the 10 PBs with worst women enrollment • Go with full force to enroll women as voters after understanding reasons • Pull up female voter turnout : Encourage women to vote • Analyze within each AC the 10 PBs with worst women voter turnout • Go with full force to encourage women to vote after understanding reasons
Analysis of Haidergarh in 2009 (46.37%) Lowest in Voter turnout
General Strategies at District Level • 1. Identification of mazras and hamlets falling in lower EP and Gender Ratio booths • 2. Identifying the reasons of low registration • 3. Involving elders and youngsters to motivate the unregistered electors to be part of the proud voter group • 4. Involving motivated students and organizations like NCC and NSS volunteers • 5. Involving political functionaries and BLAs of political parties to speak to the potential voters • 6. Launching media campaigns to educate and motivate
General Strategies at District Level • 7. Using ICE material provided by ECI and CEO U P Office from time to time • 8. Involving all government functionaries at village level particularly the female workers like Asha Bahu, Anganvadi workers and female teachers and locally habited shiksha-mitras • 9. Involving local artistes like folk singers of Awadhi and Bhojpuri • 10. Touring of women NYK volunteers in the worst GR and worst female voter turnout polling booths
Results achieved (2014) 56.39 51.46 50.63 56.21 46.37 52.3 Figures in 2009
Results achieved (2014) 49.32 43.23 42.81 47.92 39.96 44.75 Figures in 2009
Result Achieved 2014 Par. ElectionVoter Gender Ratio of District District team awarded on Voters Day 2014 for the result