Download
1 / 18
180 likes | 337 Views
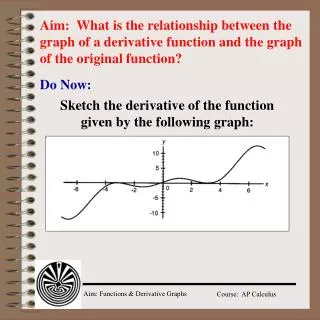
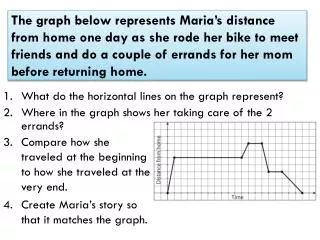
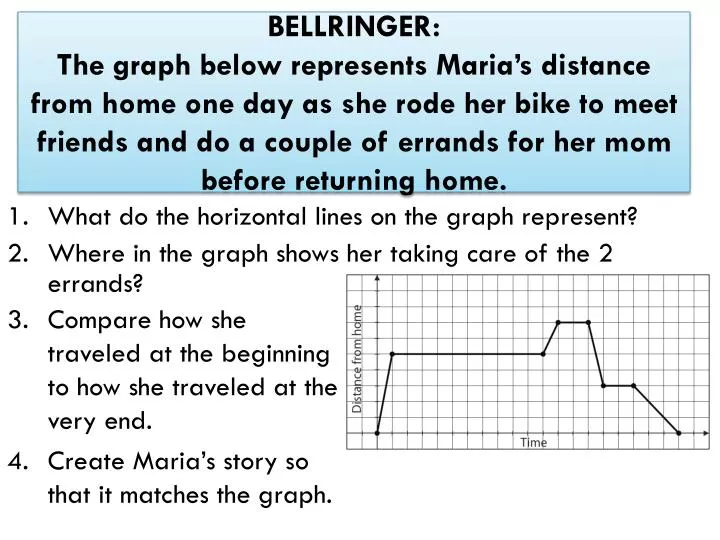
BELLRINGER: The graph below represents Maria’s distance from home one day as she rode her bike to meet friends and do a couple of errands for her mom before returning home. . What do the horizontal lines on the graph represent? Where in the graph shows her taking care of the 2 errands?.

E N D
BELLRINGER:The graph below represents Maria’s distance from home one day as she rode her bike to meet friends and do a couple of errands for her mom before returning home. • What do the horizontal lines on the graph represent? • Where in the graph shows her taking care of the 2 errands? • Compare how she traveled at the beginning to how she traveled at the very end. • Create Maria’s story so that it matches the graph.
Coordinate Algebra UNIT QUESTION: How can we use real-world situations to construct and compare linear and exponential models and solve problems? Standards: MCC9-12.A.REI.10, 11, F.IF.1-7, 9, F.BF.1-3, F.LE.1-3, 5 Today’s Question: What are the key features of a linear and an exponential function? Standards: F.IF 4, F.IF 5, F.IF 7, F.IF 7a, F.IF 7e
Intercepts • x-intercept – the point at which the line intersects the x-axis at (x, 0) • y-intercept – the point at which the line intersects the y-axis at (0, y)
Find the x and y intercepts, then graph. -3x + 2y = 12
Increasing, Decreasing, or Constant • Sweep from left to right and notice what happens to the y-values • Increasing goes up (L to R) • Decreasing falls down (L to R) • Constant is a horizontal graph
Continuous vs Discrete • Continuous has NO breaks • Discrete has gaps or breaks
Extrema • Minimum Point – least value of the function • Maximum Point – greatest value of the function
Domain & Range • Domain – all x-values of a function • Range – all y-values of a function
Notation • Interval – represents an interval as a pair of numbers. The numbers are the endpoints of the interval. Parentheses and/or brackets are used to show whether the endpoints are excluded or included • Set– using inequalities to describe the values
Asymptote A line that a graph gets closer and closer to, but never crosses or touches
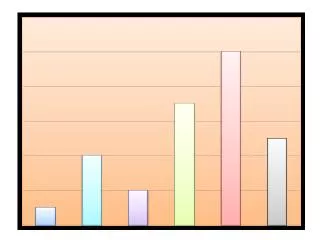
Characteristics • Domain: • Range: • Intercepts: • Increasing or Decreasing? • Maximum or Minimum?
Characteristics • Domain: • Range: • Intercepts: • Increasing or Decreasing? • Maximum or Minimum?
Characteristics • Domain: • Range: • Intercepts: • Increasing or Decreasing? • Maximum or Minimum? • Horizontal Asymptote:
Characteristics • Domain: • Range: • Intercepts: • Increasing or Decreasing? • Maximum or Minimum? • Horizontal Asymptote:
Classwork Characteristics of Functions Worksheet 7 problems
Homework Characteristics of Functions Worksheet 6 problems