Download

1 / 18
180 likes | 304 Views
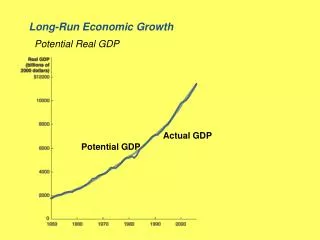
Traditional and innovative technologies and its impact on the long run economic growth in Armenia. Karen Poghosyan Central bank of Armenia. The main purpose of the research.

E N D
Traditional and innovative technologies and its impact on the long run economic growthin Armenia Karen Poghosyan Central bank of Armenia
The main purpose of the research • During the 1980 and 1990’s neoclassical economists interest in the possible role of knowledge (education, research and technology) for long-run economic growth. • An important development was the emergency of the so-called “new growth theory” (Romer 1986,1990; Agion and Howitt 1992, 1998). • Following “new growth theory” the long run economic development should be expected to depend on economic incentives to innovation, e.g., strong intellectual property rights (patents); supply of needed skills (education and research); access to relevant knowledge sources. • There are only two ways for increasing the output in the economy, 1. increasing the number of inputs (capital and labor) and 2. implementing some new technologies to get more output from the same number of inputs. • The main purpose of the research is to describe and then to measure the impacts of the traditional and innovative technological development on the long run real growth of GDP in Armenia.
The structure of the research • Endogen economic growth theory • The structure of the innovation indicators • The methodology of construction the quarterly innovation indicators • The methodology of construction aggregate innovation indicators • Estimation and forecasting results • The BVAR methodology for analysis the interactions between innovation indicators and economic growth
Romer production function • According to the Romer (1990) the final output is produced • Where L – physical labor, Hy – human capital, K = ηA. • Substituting and rearranging the components we will receive. Hy= hL, k = K/L, K = kL
National innovation system indicators Innovation inputs Business sophistication Infrastructure Institutions Human capital & research Market sophistication ICT Political environment Knowledge workers Credit Education Energy Investment Regulatory environment Innovation linkages Tertiary education General Infrastructure Trade & competition Knowledge absorption Business environment Research & development
National innovation system indicators Innovation outputs Creative outputs Scientific outputs Creative intangibles Knowledge creation Knowledge impact Creative goods & services Knowledge diffusion
Methodology for construction quarterly national innovation indicators • Temporal Decomposition algorithms 1. Univariate benchmarking 2. Univariate benchmarking with indicators 3. Multivariate benchmarking with indicators and transversal constraints • For temporal decomposition of the Armenia’s yearly innovation indicators the univariate benchmarking algorithms have been used. • For selection the best univariatebenchmarking algorithms the RMSE indicators have been used. • After temporal decomposition all quarterly time series have been logarithmed and stationarised with using Hodrick-Prescot filter. • So our data set includes stationarised with zero mean and 1 standard deviation quarterly time series.
Methodology for constructing aggregate innovation indicators • For construction the aggregate innovation indicators the principal component analysis have been used. • A principal component is a linear combination of weighted observed variables. Principal components are uncorrelated and orthogonal. Principal Component Analysis (PCA) • Is a variable reduction technique • Is used when variables are highly correlated • Reduces the number of observed variables to a smaller number of principal components which account for most of the variance of the observed variables • Is a large sample procedure
Methodology for constructing aggregate innovation indicators • The total amount of variance in PCA is equal to the number of observed variables being analyzed. In PCA, observed variables are standardized, e.g., mean = 0, standard deviation=1, diagonals of the matrix are equal to 1. The amount of variance explained is equal to the trace of the correlation matrix of the initial standardized data set. • The first extracted principal component identified accounts for most of the variance in the data. The second extracted principal component identified accounts for the second largest amount of variance in the data and is uncorrelated with the first principal component and so on. • Components accounting for maximal variance are retained while other components accounting for a trivial amount of variance are not retained. Principal components as a rule could be conducted in two steps: • On the first step should be calculated the coefficient of correlations (loadings matrix) between standardized initial time series and extracted principal components. On this step it is need to find the eigenvalues and eigenvectors of the correlation matrix of the initial data set. • On the second step with using some type of rotation (most popular is Varimax) the correlation coefficients (loadings matrix) should be rotated. The main idea of the rotation is to obtain more explainable principal components.
Regression model Regression model that we need to estimate is Ln(Yt) = β 0 + β1 ln(K1t) + β2 ln(K2t) + β3 ln(Lt) + β4ln(F1t) + β5 ln(F2t) + β6 ln(F3t) + β7 (F4t) + εt, K1t – capital consumption in traditional branches of the economy; K2t – capital consumption in innovative sectors of the economy; Lt – labor expenditure, F1t – education and research aggregate indicators; F2t – science and technology aggregate indicators; F3t – human capital aggregate indicators; F4t – public regulation aggregate indicators.
Estimation methods • Regression is one of the most commonly used statistical techniques. • The widely used approach to estimate linear regression model is standard ordinary least squares algorithms (OLS). However, OLS estimation of regression parameters are affected by the occurrence of outliers, non-normality and multicolinearity. • To remedy this problem, new statistical techniques have been developed that are not so easily affected by outliers. This new techniques are relating with the robust methods such as M estimates developed by P.Huber. • In order to see how sensitive the OLS and robust methods to the outliers let’s go to the below presented picture. • From picture we see that OLS is sensitive to outliers, while robust method is indifferent.
Estimation results and baseline forecast scenario *,** and *** are used to indicate significance at the 10%, 5% and 1% level, respectively
Impulse response analysis , , • For impulse response analysis the Bayesian VAR algorithms have been used. • In the BVAR algorithm the model parameters are estimated by the following formula. Where, X = [K1, K2, L, F1, F2, F3, F4]’; - prior parameter vector, H – prior matrix of standard errors, which can be computed based on the Litterman’s principles. , ,
Conclusions • Empirical research analysis allow us to conclude that there is a strong, significant and robust statistical relationship between GDP real growth on the one hand and innovation indicators, particularly education and research, science and technology. • Based on BVAR analysis we are able to conclude that traditional technologies still provide the main part of the GDP growth. But innovation part of the real GDP has an huge potential to maintain the accelerated growth rates of real GDP. • Traditional technologies mainly support real GDP growth for short period, while innovative technologoes support real growth for relatively long period.