Download
1 / 12
200 likes | 485 Views
Water Quality Modeling. Evaluation of Nitrogen and Phosphorus Land Surface Loads for Nueces Bay. Zsuzsanna Iwanicka University of Texas at Austin. Project Objectives. Learn about GIS application in water quality modeling Learn about data processing needs for GIS- aided water quality models.

E N D
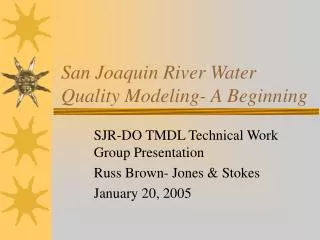
Water Quality Modeling Evaluation of Nitrogen and Phosphorus Land Surface Loads for Nueces Bay Zsuzsanna Iwanicka University of Texas at Austin
Project Objectives • Learn about GIS application in water quality modeling • Learn about data processing needs for GIS- aided water quality models
A few reasons to develop water quality models • Gain a better understanding of ecosystems • Determine the impact of human activities on water quality • Determine what is needed to improve water quality • Provide an analysis tool supporting policy decisions
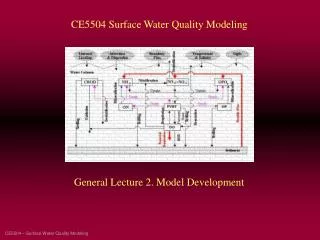
Data layers for a mass balance model Point Source Loads Atmospheric Loads Land Surface Loads Waterbody Inflow Loads Outflow Loads Sediment Loads A complete GIS based water quality model was developed by Ann M. Quenzer It is available at: http://www.ce.utexas.edu/prof/maidment/grad/quenzer/home.html
Term Project Focus • Develop a model for mean annual non-point source pollution loads in ArcGIS … …and make it user friendly
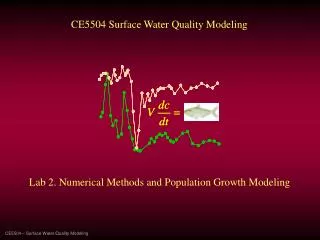
Modeling Steps I • Following Ann Quenzer’s methodology • Determine the annual surface runoff in [mm precipitation/year] through establishing a statistical relationship between: • land use type • annual precipitation • streamflow Equation: lnQ=lna+b*P+c*Ln(%A)
Modeling Steps II • Get the equation for different land use types and compute the runoff Q=ax*exp(bx*P) [mm/year] • Determine the P and N concentration* depending on land use type and compute the annual loads for the defined watershed *Study conducted for watershed provides the constituent’s concentration for different types of land use
Modeling Steps III • Getting into GIS… • Pull up the following layers: • Delineated watershed, river network… • Land use polygons • Annual Precipitation
Modeling Steps IV • Intersect land use and precipitation layer • Create the button to run the model…
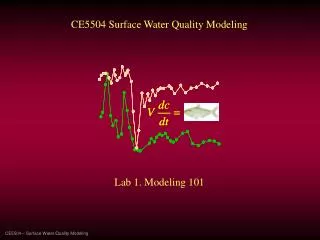
Modeling Steps V Nueces Bay - Study Area
Acknowledgements • Imane Mirni for sharing her data • Ann Quenzer for her GIS-based water quality model • Dr Maidment for the wonderful GIS classes and for his quick answers to my questions • My fellow students in the GIS class for their advice and encouragement • My husband, Jan Iwanicki, for helping me to develop the “button” and for taking care of our children during my studies