Download
1 / 17
170 likes | 319 Views
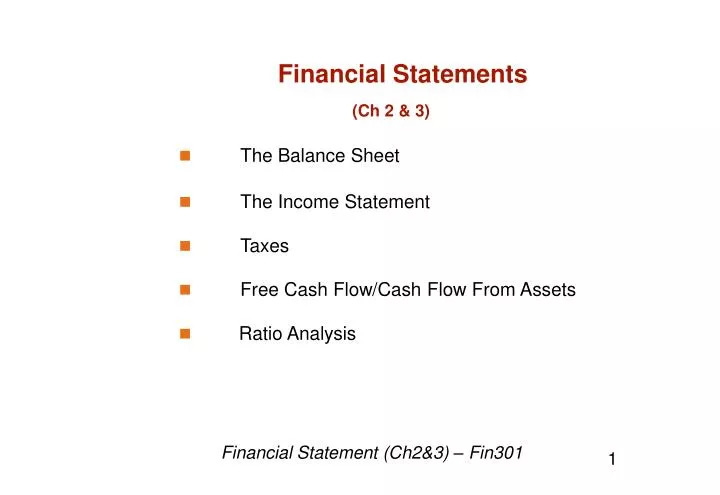
Financial Statements (Ch 2 & 3) The Balance Sheet The Income Statement Taxes Free Cash Flow/Cash Flow From Assets Ratio Analysis. Financial Statement (Ch2&3) – Fin301. 1. 1. The Balance Sheet. Balance Sheet. Assets and Liabilities Net Working Capital liquidity

E N D
Financial Statements (Ch 2 & 3) • The Balance Sheet • The Income Statement • Taxes • Free Cash Flow/Cash Flow From Assets • Ratio Analysis Financial Statement (Ch2&3) – Fin301 1
Balance Sheet • Assets and Liabilities • Net Working Capital • liquidity • Debt versus Equity • Market Value versus Book Value
GAAP General Accepted Accounting Principles: The Common Set of Standards and Procedures by which Audited Financial Statements are Prepared. • show assets at historical costs
2. Income Statement • Income Statement • actual cash flow versus realized revenues and expenses • accrual and matching • depreciation
Marginal versus Average Corporate Tax Rates • What are marginal corporate tax rates? • What are average corporate tax rates at the top of each bracket? Marginal and average tax rates under the 1993 Omnibus Budget Reconciliation Act Taxable Income Marginal Tax Cumulative Average Tax Rates Tax Liability Rates $0 - 50,000 15% 50,001 - 75,000 25% 75,001 - 100,000 34% 100,001 - 335,000 39% 335,001 - 10 mil 34% 10 mil - 15 mil 35% 15 mil - 18.33 mil 38% 18.33 mil + 35%
4. Cash Flow • Cash flow from assetsCash flow from assets = Operating cash flow – Net capital spending – Additions to net working capital (NWC) where Operating cash flow = Earnings before interest and taxes (EBIT) + Depreciation – Taxes Net capital spending = Ending net fixed assets – Beginning net fixed assets + Depreciation Change in NWC = Ending NWC – Beginning NWC (NWC: net working capital)
Balance Sheet Beg End Beg End Cash $100 $150 A/P $100 $150 A/R 200 250 N/P 200 200 Inv 300 300 C/L 300 350 C/A $600 $700 LTD $400 $420 NFA 400 500 C/S 50 60 R/E 250 370 $300 $430 Total $1000 $1200 Total $1000 $1200
Income Statement • Sales $2000 • Costs 1400 • Depreciation 100 • EBIT 500 • Interest 100 • Taxable Income 400 • Taxes 200 • Net Income $200 • Dividends $_____ • Addition to R/E _____
Cash Flow from Assets (free Cash Flow Calculation) 1. Operating cash flow = EBIT + _____________ – Taxes = $500 + 100 – 200 = $_____ 2. Change in NWC = ___________ – ___________ = $350 – $_____ = $_____ 3. Net capital spending = $_____ + Dep – _____ = $500 + 100 – 400 = $_____ 4. Cash flow from assets = OCF – chg. NWC – Cap. sp. = $400 – 50 – 200 = $150
5. Financial Ratios • Short-Term Solvency, or Liquidity • Ability to pay bills in the short-run • Long-Term Solvency, or Financial Leverage • Ability to meet long-term obligations • Asset Management, or Turnover • Intensity and efficiency of asset use • Profitability • The ability to control expenses • Market Value • Going beyond financial statements
A. Short-term Solvency, Liquidity Ratios Current assets Current ratio = Current liabilities Quick ratio = (Current assets - inventory) / Current liabilities Cash ratio = Cash / Current liabilities Current assets Interval measure = Average daily operating costs
Du Pont Identity • Return on Equity (ROE) • Return on Assets (ROA)
B. Long-term Solvency, or Financial Leverage Ratios Total assets - Total equity Total debt ratio = Total assets Debt/equity ratio = Total debt/Total equity Equity multiplier = Total assets/Total equity Long-term debt Long-term debt ratio = Long-term debt + Total equity EBIT Times interest earned ratio = Interest EBIT + depreciation Cash coverage ratio = Interest
C. Asset Utilization, or Turnover Ratios Cost of goods sold Inventory turnover = Inventory 365 days Days’ sales in inventory = Inventory turnover Sales Receivables turnover = Accounts receivable 365 days Days’ sales in receivables = Receivables turnover Sales NWC turnover = NWC Sales Fixed asset turnover = Net fixed assets Sales Total asset turnover = Total assets
D. Profitability Ratios Net income Profit margin = Sales Net income Return on assets (ROA) = Total assets Net income Return on equity (ROE) = Total equity
E. Market Value Ratios Price per share Price-earnings ratio = Earnings per share Market value per share Market-to-book ratio = Book value per share