Download
1 / 12
120 likes | 357 Views
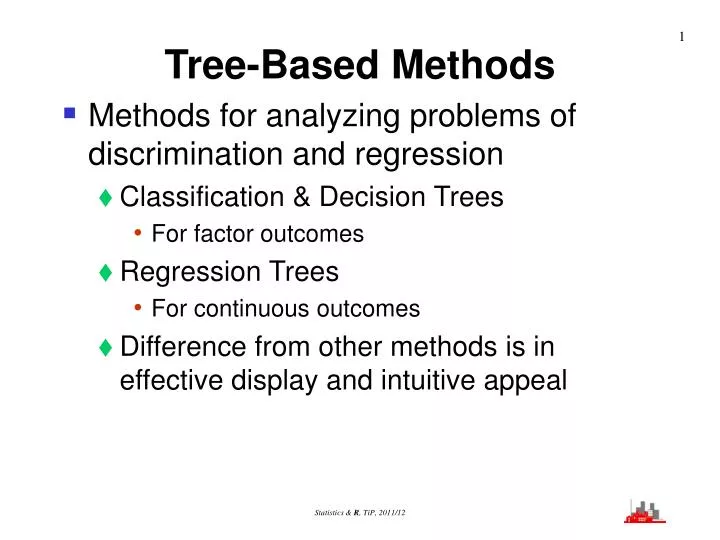
Tree-Based Methods Methods for analyzing problems of discrimination and regression Classification & Decision Trees For factor outcomes Regression Trees For continuous outcomes Difference from other methods is in effective display and intuitive appeal. Classification Trees

E N D
Tree-Based Methods • Methods for analyzing problems of discrimination and regression • Classification & Decision Trees • For factor outcomes • Regression Trees • For continuous outcomes • Difference from other methods is in effective display and intuitive appeal Statistics & R, TiP, 2011/12
Classification Trees • Aim is to find a rule for classifying cases • Use a step-by-step approach • (one variable at a time) • Aim is to produce a rule for classifying objects into categories • Similar problems of evaluation of performance • high dimensions and complicated rules give over-optimistic performance Statistics & R, TiP, 2011/12
Example: Iris data 1st: divide on petal length:- If petal length < 2.5 then type “S” 2nd: petal width If width < 1.75 then most of type “C” If length < 4.95 then “C” and if > 4.95 then “V” If width >1.75 then “V” Statistics & R, TiP, 2011/12
Can display this as a tree: Is petal length < 2.5? yes no Is petal width < 1.75? yes no Type “S” Is petal length < 4.95? Type “V” yes no Type “V” Type “C” Statistics & R, TiP, 2011/12
> library(tree) > ir.tr<-+ tree(ir.species~ir) > plot(ir.tr) > text(ir.tr, + all=T,cex=0.8) • Note • call to library(tree) • addition of labels with text() • cex controls character size Statistics & R, TiP, 2011/12
Note misclassification rate with this tree is 4/150 or correct rate is 146/150 • Compare LDA of 147/150 • Could look at cross-validation method • Special routine tree.cv(.) • Could permute labels • Note we can grow tree on a random sample of data and then use it to classify new data (as with lda) Statistics & R, TiP, 2011/12
> irsamp.tr<-+ tree(ir.species[samp]~ir[samp,])> ir.pred<-predict(irsamp.tr,+ ir[-samp,],type="class") > table(ir.pred,ir.species[-samp]) irpred c s v c 24 0 0 s 0 25 0 v 1 0 25 • So correct classification rate of 74/75 Statistics & R, TiP, 2011/12
Other facilities snip.tree(.) • Interactive chopping of tree to remove unwanted branches • Works in similar way toidentify() • Try help(snip.tree) • library(help=tree) for list of all facilities in library tree • Also library(rpart) Statistics & R, TiP, 2011/12
Similar Methods • Decision trees • Essentially the same as classification trees • See shuttle example • Regression trees • Continuous outcome to be predicted from explanatory independent variables Can be • continuous • ordered factors • multiple unordered categories • Continuous outcome is made ‘discrete’ • makes it similar to classification trees Statistics & R, TiP, 2011/12
> cpus.tr<-+ tree(log(perf)~.,cpus[,2:8]) > plot(cpus.tr) > text(cpus.tr,cex=1.0) Gives a quick way of predicting performance from properties e.g. machine with cach=25nmax= 7500syct=300chmin=6.0 Statistics & R, TiP, 2011/12
Comments on mathematics • PCA and lda have rigorous mathematical foundation • Obtained from applications of general statistical theory • Results similar to Neyman-Pearson Lemma etc., etc. • Tree-Based Methods WORK in practice • algorithmic basis instead of mathematical • Give good results in some cases when classical methods are less satisfactory Statistics & R, TiP, 2011/12
Summary • Classification & Regression Trees • Take one variable at a time • Facilities for cross-validation and randomization • Variables can be continuous or ordered or unordered factors • Facilities for interactive pruning • Can be problems with high dimensionsand small numbers of cases • Theoretical foundation is algorithmic not mathematical • They can WORK in practice Statistics & R, TiP, 2011/12