Download
1 / 16
170 likes | 295 Views
Severity Index for patients with Liver Cirrhosis disease. Health Decision Analysis 730-001 Yokabid Worku Ymelat@hotmail.com 02-19-04. Outline. Liver Cirrhosis and its measures of damage

E N D
Severity Index for patients with Liver Cirrhosis disease Health Decision Analysis 730-001 Yokabid Worku Ymelat@hotmail.com 02-19-04
Outline • Liver Cirrhosis and its measures of damage • Selecting Attributes in accordance of their importance • Review of Attribute • Description of Attributes • Attribute levels and assigning values • Calculation Attributes weights • Modeling Severity index and scenarios • Severity index for Liver Cirrhosis disease • What the results mean • Correlation Graph • Evaluation of the Model
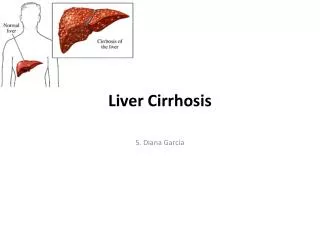
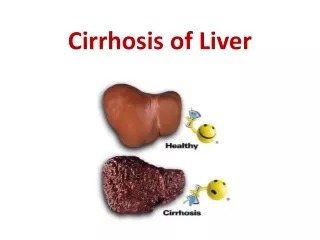
Liver Cirrhosis and its measures of damage • Liver Cirrhosis is the result of chronic liver disease that causes scarring of the liver and liver dysfunction. Common causes include alcohol abuse and hepatitis C infection. Patients with Liver disease suffer several illnesses. • In this search, a value model was used to create a severity index for Liver Cirrhosis patients. A value model is the best tool to prioritize for evaluation of the diseases’ severity level. This model will help quantify preferences. These preferences were quantified by examining the various attributes of the disease. To clearly show the importance of each attribute, a severity index was constructed based on the input of expert.
Selecting Attributes • After a brief introductory, the expert was notified of the model’s purpose and how it would be developed. • To help understand which attributes could be used to indicate severity level, the expert was asked to recall the worst and the best attributes of the disease. • By contrasting patients, attributes were solicited, thus helping single out those attributes that truly affect prognosis. At this point, the expert was asked to identify for additional attributes. • All the attributes were arranged in order of their hierarchy.
Review of Attributes • Tests were conducted to ensure all attributes were exhaustive, important, and not dependent and not redundant. Further more, Attributes were minimized to achieve independency in preference. • Discussion with the expert led to the following set of eight attributes. • Leg Edema • Red Blood Cell Count (Hemoglobin Count) • Ascites • Bleeding esophageal varices • CNS (Hepatic encephalopathy) • Jaundice (yellow discoloration) • Platelets count (Thrombocythemia) • Albumin (protein)
Description of Attributes • Leg Edema- Swelling of the ankles/ feet/ legs, caused by abnormal buildup of fluid in these areas. • Red Blood Cell Count (Hemoglobin count)- inadequate number of circulating red blood cells, caused by premature destruction of red blood cells. • Ascites- excess fluid in the space between the lining of the abdomen. • Bleeding esophageal varices-dilated veins in the walls of the lower part of the esophagus and sometimes the upper part of the stomach. • CNS (Hepatic encephalopathy)- is brain and nervous system damage characterized by changes in consciousness and behavior changes. • Jaundice (yellow discoloration)- yellow color in the skin or the eyes, caused by too many red blood cells (bilirubin) retiring. • Platelets count (Thrombocythemia)- abnormality of a very immature cell in the bone marrow, producing blood cells affecting the platelets. • Albumin (protein)- clear fluid portion of blood (serum), protein of the highest concentration in plasma.
Table1: Shows Attribute levels ranging from best to worst, and the value assigned for each level.Attributes were listed in the order of their importance to show severity level for Liver Cirrhosis disease. Each level was assigned a value relative to its’ actual value using same scale.
Table 2: Calculation of attributes weightThe method used to weigh the attributes was by assessing the ratio of the importance of two attributes. The least important attribute was assigned 10 points. Then, the expert was asked to estimate the relative importance of the other attributes in relation to Leg Edema.
Cont. on Calculation of Weights • As shown in Table 2, the weights for the remaining attributes were calculated then followed by normalizing the total weight to 1. • The weights correlated quite well with the experts’ judgments of the rank order, that confirmed accuracy of the attribute levels and their importance.
Modeling Severity index and Scenarios • In order to increase confidence in the model, and to establish the validity of a model, the model should stimulate the judgment of the expert thus, scenarios were generated. • An attribute level was selected randomly from all eight attributes to come up with a scenario. • Double anchored equation was used to produce one overall score for every scenario. • Then, the expert was asked to score these hypothetical case profiles described only by variables included in the model. • The method was used to show relation, to have confidence in the model and to achieve face validity.
Cont. from Table 3: What the Result mean • The model adequately predicted the expert’s judgments, this increased confidence in the model. • Higher scores indicated high severity level thus, less survival time. • Lower scores indicated low severity level thus, high survival time. • The overall model scores calculated showed severity level for each scenario. • This method established validity for this model measuring the severity index level for Liver Cirrhosis patients.
Correlation GraphFigure 1: Shows the correlation between the expert rating v.s. Model scores of severity level for eight scenarios.
Cont. on Correlation graph • The correlation between the model score and the experts’ rating was 0.933 suggesting high agreement between the model and the experts’ perception. • A correlation closer to 1.0 implies greater agreement proving, the high correlation had stimulated the judgment of the expert.
Evaluation of the Model • The expert considered the model simple to use and face valid. • The model had corresponded valid with other measures such as, correlation graph which proved to have stimulated the experts’ judgment on the given scenarios. • The model score and the experts’ rating correlated positively. This is true, because as the model scores increased, the experts’ ratings showed tendency to increase correspondingly in a similar trend. • Techniques used in modeling values adequately served in measuring the severity level for Liver Cirrhosis disease by allowing to compare the scores between the experts’ ratings and model scores.
Reference • The expert in question is Ambachew Woreta M.D., whose primary practice is in the field of internal medicine. Dr. Woretas’ familiarity with this field served as justification for his involvement in this project.