Download
1 / 1
10 likes | 102 Views
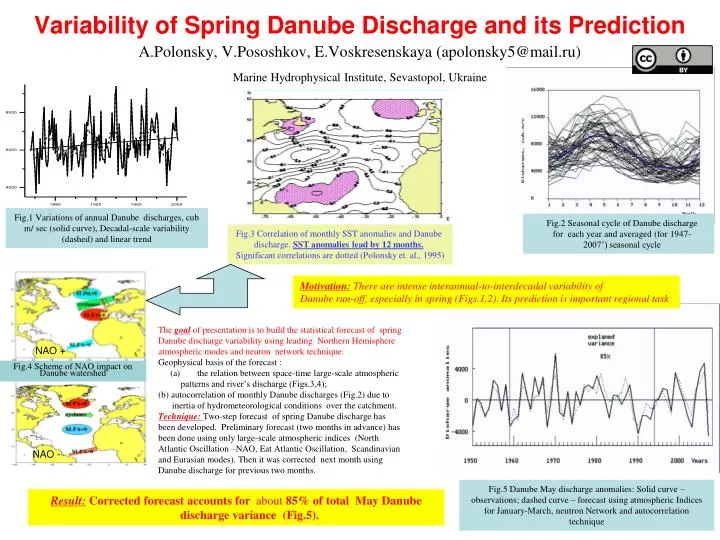
Variability of Spring Danube Discharge and its Prediction A.Polonsky, V.Pososhkov, E.Voskresenskaya (apolonsky5@mail.ru) Marine Hydrophysical Institute, Sevastopol, Ukraine.

E N D
Variability of Spring Danube Discharge and its PredictionA.Polonsky, V.Pososhkov, E.Voskresenskaya (apolonsky5@mail.ru)Marine Hydrophysical Institute, Sevastopol, Ukraine Fig.1 Variations of annual Danube discharges, cub m/ sec (solid curve), Decadal-scale variability (dashed) and linear trend Fig.2 Seasonal cycle of Danube discharge for each year and averaged (for 1947- 2007’) seasonal cycle Fig.3 Correlation of monthly SST anomalies and Danube discharge. SST anomalies lead by 12 months. Significant correlations are dotted (Polonsky et. al., 1995) Motivation: There are intense interannual-to-interdecadal variability of Danube run-off, especially in spring (Figs.1,2). Its prediction is important regional task • The goalof presentation is to build the statistical forecast of spring • Danube discharge variability using leading Northern Hemisphere • atmospheric modes and neuron network technique. • Geophysical basis of the forecast : • the relation between space-time large-scale atmospheric • patterns and river’s discharge (Figs.3,4); • (b) autocorrelation of monthly Danube discharges (Fig.2) due to • inertia of hydrometeorological conditions over the catchment. • Technique: Two-step forecast of spring Danube discharge has • been developed. Preliminary forecast (two months in advance) has • been done using only large-scale atmospheric indices (North • Atlantic Oscillation –NAO, Eat Atlantic Oscillation, Scandinavian • and Eurasian modes). Then it was corrected next month using • Danube discharge for previous two months. NAO + Fig.4 Scheme of NAO impact on Danube watershed NAO - Fig.5 Danube May discharge anomalies: Solid curve –observations; dashed curve – forecast using atmospheric Indices for January-March, neutron Network and autocorrelation technique Result: Corrected forecast accounts for about 85% of total May Danube discharge variance (Fig.5).