Download
1 / 25
250 likes | 350 Views
Estimating forest structure in wetlands using multitemporal SAR by Philip A. Townsend. Neal Simpson ES 5053 Final Project. Introduction. Estimating biophysical characteristics of forested wetlands a hot topic in remote sensing.

E N D
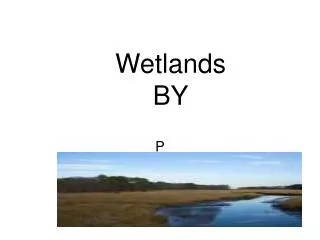
Estimating forest structure in wetlands using multitemporal SAR by Philip A. Townsend Neal Simpson ES 5053 Final Project
Introduction • Estimating biophysical characteristics of forested wetlands a hot topic in remote sensing. • Promising results have been found for measuring biomass, tree height, basal area, tree density, and forest class cover in previous studies.
Introduction • Roanoke River Floodplain, North Carolina • Sites consist of diverse assemblage of bottomland hardwoods and swamp forests that annually flood.
Introduction • Use of widely available satellite-borne synthetic aperture radar (SAR) sensors to determine if study of forests over broad geographic areas and complex environmental gradients is possible. • This would provide important information about global change and represent the scientific basis for regional scale forest assessment.
Introduction • Benefits of SAR: • It’s not attenuated by atmosphere • SAR backscatter is responsive to multiple structural elements of forest canopies.
Introduction • Limitations: • Previous studies data not widely available to most people. • SAR platforms produce single-band, single polarization imagery which exhibit strong relationships with forest bio-physical properties. • Variations in environmental conditions affect backscatter from forests, especially in flooded areas without in-situ data.
Objectives • Evaluate the capabilities of multitemporal SAR from Radarsat, ERS, and JERS for estimating bio-physical properties of forested wetlands on the lower Roanoke River floodplain, North Carolina.
Objectives • How does sensitivity of SAR imagery to forest bio-physical properties differ for flooded and non-flooded forests? • Can multitemporal SAR imagery be used to estimate forest bio-physical attributes accurately? • Does integration of multispectral optical imagery with SAR data substantially improve the ability to detect forest properties? • What effect do other forest and surface properties have on radar backscatter from forested wetlands?
Methods • 202 sites in the floodplain examined from 11 Radarsat, 2 ERS, and 1 JERS images. • Multitemporal data sets of Landsat TM for vegetation and soils from 116 of the sites were analyzed with SAR images. • Landsat TM images used for forest cover classification and integrated with SAR images. • SAR imagery was analyzed either flooded or non-flooded and by seasonality.
Methods • In-situ 90x90m plots tested for density, basal area (BA), and leaf area index (LAI). • Soil samples analyzed for organic matter and silt, sand, and clay %. • All sites were collected with differentially corrected GPS coordinates.
Statistical Analysis • Multivariate linear statistical analysis to predict bio-physical properties from the SAR images. • Analysis stratified by flooding status. • Three categories of analysis: • Based on plots that were flooded on the same dates. • Based on plots that were not flooded on the same dates. • Based on plots that are flooded on some dates and not flooded on others.
Statistical Analysis • Shapiro-Wilk test for normality of forest structure data. • Simple and Multiple regressions used to test relationship between forest structure and radar backscatter at P >0.05.
Results Relationships between forest structure and radar Scattering Flooded vs. Non-Flooded • Correlations affected by stratification of data. • Correlations strongest for flooded areas, due to the high backscatter and double bounce scattering.
Results Flooded vs. Non-Flooded • Strong correlation between basal area and height in flooded sites and backscatter due to the flooding.
Results Leaf-on vs. Leaf-off • Both conditions were responsive to forest structure especially for basal area. • Suggests seasonal differences may be predictable by using SAR.
Results Wavelength, polarization, and incidence angle • Incidence angle-very little difference • Polarization- CVV and CHH in all three sensors showed they were useful for detecting forest properties in different polarizations. • C and L bands showed strong responsiveness.
Results Estimating forest structure using multitemporal, multisensor SAR • LAI, crown depth, and crown closure better analyzed with optical imagery. • Forest height in flooded conditions responsive.
Results Estimating forest structure using multitemporal, multisensor SAR • Responsiveness of SAR to BA under both flooded and non-flooded conditions with leaf on and leaf off. • Responsive to estimate BA even in high BA plots.
Results Integration with optical data • Landsat TM images with SAR images ran to see if improved model performance. • NDVI used to determine vegetation properties. • During leaf-on imagery, model improved slightly as with flooded times.
Results Integration with optical data • Canopy height improved the model unexpectedly, but only slightly. • Overall model improved only slightly.
Results Relationship between backscatter and other variables Land cover type • Relationships were not strong, and very few classes exhibited statistically significant differences. • Forest types are more closely related to the average environmental conditions.
Results Relationship between backscatter and other variables • Only Tupelo-Cypress forests have distinctly different backscatter responses, due to a high BA.
Results Soil properties • Environmental factors other than flooding and vegetation affect backscatter from forests. • Non-flooded areas only analyzed. • Very few correlations were determined between soil properties and backscatter. • Clay and organic matter had the highest correlations, due to high soil moisture content.
Conclusions • SAR imagery offers some usefulness in measuring bio-physical properties of forested wetlands. • Most effective for BA and Canopy crown. • SAR imagery more sensitive to forest structure than forest composition. • Results also showed stratification of data between flooded and non-flooded sites is extremely important. • Optical imagery only improved model slightly. • Results indicate the necessity for caution when using SAR data to characterize forest properties over large and diverse areas.
Conclusions • The launch of multi-polarization satellite SAR system Envisat-1, will offer cross-polarized imagery that hopefully will improve the ability to map forest properties over large areas using single-date SAR.