Download
1 / 9
90 likes | 223 Views
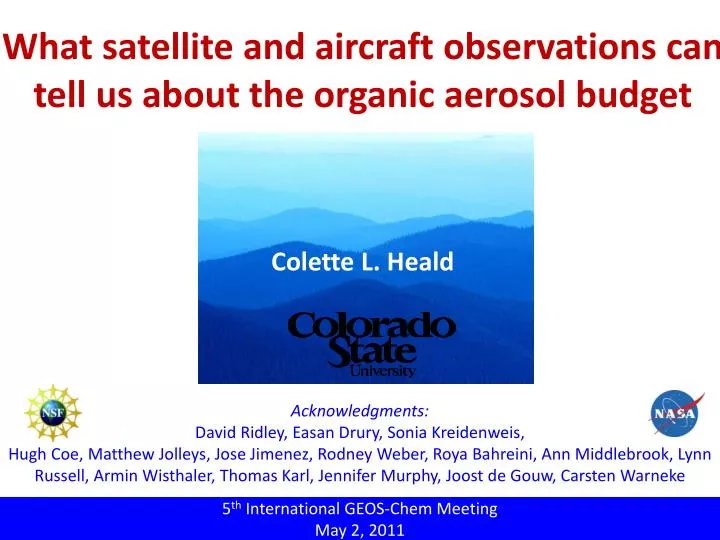
What satellite and aircraft observations can tell us about the organic aerosol budget. Colette L. Heald. Acknowledgments: David Ridley, Easan Drury, Sonia Kreidenweis ,

E N D
What satellite and aircraft observations can tell us about the organic aerosol budget Colette L. Heald Acknowledgments: David Ridley, Easan Drury, Sonia Kreidenweis, Hugh Coe, Matthew Jolleys, Jose Jimenez, Rodney Weber, RoyaBahreini, Ann Middlebrook, Lynn Russell, Armin Wisthaler, Thomas Karl, Jennifer Murphy, Joost de Gouw, CarstenWarneke 5th International GEOS-Chem Meeting May 2, 2011
FIRST… SOME INTRODUCTIONS Kateryna Lapina, Postdoc Talk: next! Bonne Ford, graduate student Poster: Tuesday Dave Ridley, Postdoc Talk: after lunch Luke Schiferl, graduate student Maria Val Martin Research Scientist just joined group!
CAN SATELLITE OBSERVATIONS SHED ANY LIGHT ON THE BUDGET OF OA? Bottom-up calculations suggest that SOA source may be anywhere from 140-910 TgC/yr [Goldstein and Galbally, 2007]. SATELLITE AOD Assumptions: Optical Properties Size Distributions Aerosol Distributions AEROSOL SPECIATED MASS CONCENTRATIONS Dust Organic aerosol Sulfate Sea Salt Nitrate Soot SURFACE REFLECTANCE
ATTRIBUTE ENTIRE MODEL UNDERESTIMATE OF AOD TO ORGANICS DJF JJA Estimate that ~150 TgC/yr source is required to close the MISR-GEOS-Chem* discrepancy. MISR GEOS-Chem* MISR- GEOS-Chem* *excluding OA (v8-02-04)
HAVE WE REDUCED THE UNCERTAINTY ON THE OA BUDGET? 910 Range estimated by: Goldstein and Galbally [2007] This is more than THREE TIMES what is currently included in global models…. BUT at the low end of Goldstein & Gallbally [2007] range. 140 Our satellite top-down estimate 150 47 Existing GEOS-Chem sources All units in TgCyr-1 [Heald et al., 2010]
DIGGING IN DEEPER: 17 AIRCRAFT FIELD CAMPAIGNS 2001-2009 Aircraft constraints on the organic aerosol distribution through depth of troposphere in remote, polluted and fire influenced regions. * All AMS measurements, except ITCT-2K4 (PILS) and ACE-Asia (filters).
COMPARISON OF VERTICAL PROFILE GEOS-Chem: v8-03-01 with GEOS-5 met product (GEOS-4 for ACE-Asia only), simulations matched to year and location of aircraft, standard POA, BSOA and ASOA.
OVERALL COMPARISON OF OA SIMULATION In median observations range from 0.45-4.5 of simulated. Difference is largest close to source.
CAN WE ATTRIBUTE THE MODEL UNDERESTIMATE? Adding ~100 Tg/yr source of ASOA (as suggested by Spracklen et al., 2011) improves comparison in polluted regions, but leads to too much OA aloft and in remote regions. OA sink? Higher volatility OA? [Heald et al., in prep]


![[SII] Observations and what they can tell us](https://cdn3.slideserve.com/6722376/sii-observations-and-what-they-can-tell-us-dt.jpg)