Download
1 / 16
160 likes | 216 Views
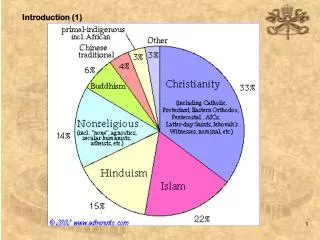
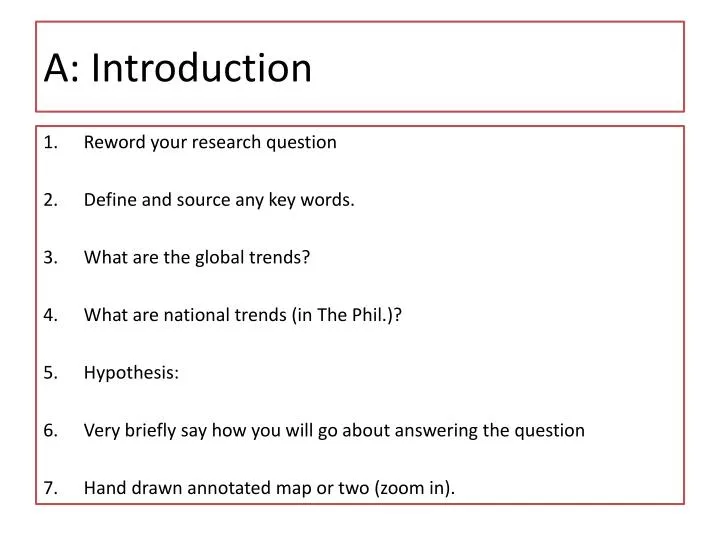
A: Introduction. Reword your research question Define and source any key words. What are the global trends? What are national trends (in The Phil.)? Hypothesis: Very briefly say how you will go about answering the question Hand drawn annotated map or two (zoom in ). B: Methodology.

E N D
A: Introduction • Reword your research question • Define and source any key words. • What are the global trends? • What are national trends (in The Phil.)? • Hypothesis: • Very briefly say how you will go about answering the question • Hand drawn annotated map or two (zoom in).
B: Methodology Vocab: Subjective objective Representative Sample sample size Reliable methods Accurate data Valid results
Figure XX: Results from the bipolar analysis. Scores out of 5.
Quality of the environment: Bipolar analysis Choose one of the ones to the left. Then you may do: Total score for each area Average score for each area Divided bar graph.
Land use maps Categorise the different land uses? Residential Industrial Commercial Recreational
Bar graphs for: Income R and U Education R and U Number of children R and U
Annotated photos • Choose at least one photo of each area, ideally two. • Give each a title. Figure XX: Photo of……. • Paste then onto one/two pages in your Data presentation section • Annotate them with any information that links to quality of life. Tip: sentences not labels.
Description and explanation/data analysis – Quality of the environment Social conditions Services/jobs/facilities in area
Description and explanation/data analysis – (also see model answer on next slide) 1-2 paragraphs for each section Describe – say what you see in your graphs, use numbers (rounded off), mention patterns, anomalies (data that doesn’t follow pattern) Explain – try to suggest why you found what you did Then – at the end: Links between data – Is there a link between income and Q of housing, education level and income, number of children and education or income, land use and income. Mention any studies/reports from the Internet that back up your findings, or not.
Model answer for ISM Quality of environment Both the photos and the bipolar analysis, Figures 3 and 4, show the Elementary School to be a much more attractive environment to live in. The ES scored higher on every category, except for noise. The ESs overall score, 40, was over twice that of the HS, 18, which shows the ES’s environment is considerably better. Figure 4 clearly shows the recent clean up that has taken place in the ES canteen. The reasons for this could be that ES students complete lots of art work. In addition, the ES has recently been repainted. The reason for the anomaly with noise is that ES students tend to be quite loud. Studies from other schools show that ISM follows the general pattern. McLean, 2006, stated “All around the world we are seeing ES buildings which are bright and colourful”.
F: Evaluation Vocab: Subjective objective Representative Sample sample size Reliable methods Accurate data Valid results
CONCLUSION Start with a sentence saying whether you have a valid conclusion (do you think what you found was ‘right’ or did you get poor results – hopefully not) Reliable methods accurate results valid conclusions State your research question and an answer to it, backing up what you say very briefly with rounded off figures from the description section – environment, social, services. Accept/reject hypothesis – maybe partly accept it Relate to what is going on in The Philippines. Do Pagsanjan and Magdalena follow the national pattern? What are the implications of your study? What does this mean for Magdalena or Pagsanjan? What does it mean for city planners? e.g. Should more money be put into one area? Should planners be stopping the outflow of people from rural areas?
SOURCES: List any sources using MLA Acknowledge any photos from classmates