Download
1 / 62
620 likes | 784 Views
Inland Bays Pollution Control Strategy. 10 December 2004. Overview. TMDLs Pollution Control Strategy development process Tributary Action Teams PCS workgroup Progress to date Point Sources Nonpoint Sources The Pollution Control Strategy Point Source Nonpoint Sources Agriculture

E N D
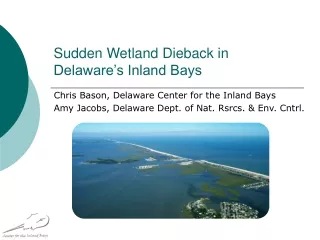
Inland Bays Pollution Control Strategy 10 December 2004
Overview • TMDLs • Pollution Control Strategy development process • Tributary Action Teams • PCS workgroup • Progress to date • Point Sources • Nonpoint Sources • The Pollution Control Strategy • Point Source • Nonpoint Sources • Agriculture • Urban • Wastewater • Concurrence • Review Costs and Nutrient Reductions • Comments
TMDLTotal Maximum Daily Load • Systematic elimination of all point sources of nutrient loading • Remove 40-85% nonpoint N • Remove 40-65% nonpoint P • 20% reduction in atmospheric deposition of N via Clean Air Act • Implementation through a Pollution Control Strategy
Why implement? • Achieve water quality standards • Water quality adequate for designated uses • Exceptional recreational and/or ecological significance • Aquatic uses • Swimming, boating, fishing, etc.
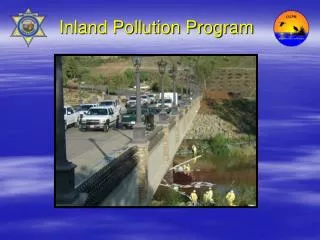
Bald Eagle Creek, July 7, 2000
What is a Pollution Control Strategy (PCS)? • Set of actions that are designed to achieve the TMDL by reducing nutrient loading • Implement the PCS through regulation although the components may be a combination of voluntary and required actions • The “Tributary Action Team” recommends the PCS to the Department for promulgation
What is a Tributary Action Team? • A group of citizens • With varying interests, concerns, knowledge and beliefs • Who meet with the purpose of recommending a Pollution Control Strategy to the Department
Why Tributary Action Teams? • Involve all members of the community • Gain the perspectives and knowledge of the people likely to be impacted by the PCS • Have the public recommend a PCS with which they are willing to comply
Public Talk—Real Choices • Move the formulation and creation of a major public policy from the agency to the public • Deliberation and Dialogue • “Front-load” the public in the process
Public Talk—Real Choices • Organize a Team • Education • Issue Framing • Evaluate Issue Framework • Public Forums • Recommendations
Inland Bays TAT History • Convened by Center for the Inland Bays • Joined with TMDL Advisory Committee • Sent three sets of recommendations for the PCS to DNREC • Addressed wastewater, development, stormwater • Silent on agriculture
IB-TAT & Agriculture • Beginning of TAT process also beginning of discussion on the Nutrient Management Act • Agriculture was taken off the table • No consensus on BMP efficiencies • Need to account for Ag progress • Needed an agriculture component to the Strategy
PCS Workgroup • Members from various agencies • DNMC staff • DNREC: DWR & DSWC • NRCS • Sussex Conservation District • Kent Conservation District • University of Delaware Cooperative Extension • Mission: To devise a method to estimate how existing agricultural practices have already contributed to achieving the TMDL-mandated nutrient load reductions …
PCS Workgroup Decisions • Calculations/recommendations based on best available science • Averages from several studies and/or ranges • Dependent on weather and site specific conditions • A lag time (1-40 years) likely exists between practice implementation and surface water quality improvement
Nutrient Management Commission Decisions • Concurred with Workgroup decisions on BMP efficiencies • Endorsed concept of Ag BMP goals in PCS • Recognize the enormous contributions that Agriculture has made toward reducing nonpoint source pollutant loadings to the Inland Bays • Everyone needs to do their fair share
The PCS Document • Progress to date • Point source • Nonpoint source • Recommendations for future actions • How the PCS should achieve the TMDL • Costs • Implementing Organizations
Point Source Progress to Date • 13 sources to be eliminated • 7 eliminated • 1 trade (Vlasic/Pinnacle Foods) • 5 sources remain
7 eliminated Delaware Seashore State Park Frankford Elementary School Colonial East Mobile Home Park Townsend’s (2 sources) Delaware State Housing Authority Georgetown Wastewater Treatment Plant 1 trade (Vlasic/Pinnacle Foods) 5 remaining NRG/Conectiv/DP&L Bayshore Mobile Home Park Permit exp. 2005 Lewes Wastewater Treatment Plant negotiations Millsboro Wastewater Treatment Plant Exploring alternatives Rehoboth Wastewater Treatment Plant Consent decree Point Source Progress to Date
Point Source Progress 82.5% 8.5%
NPS Progress to Date--Wastewater • 16,534 OWTDS on central sewer • 90% removal efficiency for Wolf Neck • 100% efficiency for South Coastal • Total 517 lb/day TN & 37 lbs/day TP removed • $9.8 million/year or $52/lbTN removed • Or $8500 per system
NPS Progress to Date--Wastewater • Holding Tank Inspection Program • 182 holding tanks • Pumped 12 times/yr • 14 lb/day TN & 4.6 lb/day TP removed • $92/lb TN removed or $2,550/system/yr
NPS Progress to Date—Stormwater • Implementation of Sediment and Stormwater Law • 130 acres treated • 22 lb/day TN & 1.5 lb/day TP removed • $62-313/lb TN reduced
Stormwater Wastewater Agriculture NPS Progress to Date 26% 60%
The POLLUTION CONTROL STRATEGY Recommendations • Guiding Principles • Point Sources • Nonpoint Sources • Agriculture • Urban/Suburban • Wastewater • Stormwater • Concurrence
Guiding Principles • A public policy of incentives, when strengthened with the threat of regulation, should allow people to innovate within their own financial constraints. • Education needs to be applied “across the board” with emphasis on the younger generation. • Be able to adapt to changes in scientific knowledge, but not allow the need for scientific certainty to prevent action from taking place immediately.
Guiding Principles • Recognize the need for experts and professionals as well as the need for community participation in the development and implementation of policy. • Cost-benefit analyses are important tools, yet they should be used efficiently, within bounds, and not as delay tactics. • Recognize the importance of “political players” in accomplishing Pollution Control Strategies. • People want to know where their tax money is being applied.
Point Sources • Systematic elimination • To require the elimination of waste loading into the affected waterbody by point sources on a firm, fixed schedule as approved by the Department. This elimination must occur within five years of the expiration of the facility’s current NPDES permit unless a longer period of time is provided for in a State or Federally enforceable Consent Order, Decree, or Administrative Order. • Water quality trading available as an option • 2:1 ratio • Must achieve the NPS reduction before can generate credit
Agriculture Implementation Goals • Full compliance with NMA • VOLUNTARY • Maintain existing BMPs • Continue use of phytase and other feed amendments • Minimize land taken out of production • BMP goals would remove less than 7% of agricultural lands from production • Least cost of all nonpoint source BMPs; most “bang for the buck”
Agriculture Implementation Goals • 39,105 acres of cover crops (annually) • 1,630 acres in forested buffer • 1,630 acres restored as wetlands • Add an additional 50 storage/compost structures • Increase the manure relocated to 21,730 tons • Treat an additional 450 acres with water control structures
Urban/Suburban • Voluntary • The Strategies for State Policies and Spending and other incentive/disincentive tools should be specifically tied to natural resource protection goals in the Inland Bays Watershed. • Develop a program that addresses practices that may result in nutrient reductions on parcels of 10 acres or less where nutrients are applied. These shall include, but are not limited to: establishing nutrient budgets for homeowners, technical support for small landowners, and education.
Urban/Suburban • Regulatory • Designation of the Inland Bays Watershed as a ‘Critical Environmental Area.’ The entire Inland Bays Watershed shall be managed for nutrient reductions consistent with TMDL load reductions, or reductions attributed to ‘best available technologies’ (BATs). • Open space shall be managed to reduce nutrient loading.
Urban/Suburban • Regulatory • Upon the development of a parcel, a nutrient budget must be produced. The nutrient budget must illustrate that the future land use will reduce nutrient loading by the percentage required by the TMDL for the waterbody in which watershed the particular location exists (or uses all available BMPs). • The Department shall not issue any permit for a parcel or project unless a submitted and approved nutrient budget shows that the parcel or project will achieve the TMDL-required nutrient load reduction (or uses all available BMPs). • Require urban/residential riparian buffers of 100 feet from all perennial and intermittent streams.
Nutrient Budget • Protocol designed to evaluate the impact of a land use change on nutrient loading • Based on the use of best management practices, their nutrient reduction efficiencies, and land use loading rates based in scientific literature • Piloted during the PLUS process • Use is required before release of any DNREC permit
Non-Agricultural Buffers • Only for NEW developments • Tier 1 • 50’ closest to water or wetland • Vegetation requirement (trees) • Tier 2 • 25’ from outer edge of Tier 1 • Vegetation requirement (trees, shrubs) • Tier 3 • 25’ from outer Tier 2 • Vegetation requirement (trees, shrubs, or grasses) • Allows for an average of 100 feet as long as 80% meets a minimum of 50 feet
Wastewater • Voluntary • Sussex County converts an additional pre-existing 5,000 individual onsite systems to central sewer. • 100% efficiency for South Coastal • Total 170 lb/day TN & 12 lb/day TP removed • $60/lb TN removed • Or $10,000-11,000 per system • Or $657/system/yr • Economic assistance for those in need will be available through the Financial Assistance Branch, Division of Water Resources.
Wastewater • Regulatory • The DNREC, Division of Water Resources, Ground Water Discharges Section shall implement a compliance and inspection program for individual onsite wastewater treatment and disposal systems in order to enforce existing requirements that the associated tanks be pumped every three years by a licensed liquid waste hauler and that alternative systems are maintained in accordance with manufacturers’ specifications. • Proof of pump-out at property transfer • Permanent holding tanks shall not be permitted within the watershed. A permanent holding tank is a tank that will be in use for 4 years or more. • Maintain the existing Holding Tank inspection program.
Wastewater • Regulatory • All new or replacement on-site wastewater disposal systems must be designed to achieve performance standards as specified in the PCS regulation. These standards vary based on system size. In addition, all existing functional systems must be retrofitted in accordance with the performance standards within 15 years of the promulgation of the PCS regulation. Systems in compliance with inspection requirements and standards, which are slated to be connected to central sewer within this same time period, will be exempt from this requirement.
Performance Standards • Tiered based on system size • Nitrogen based • Provision for requiring Phosphorus standards • Built-in inspection • Ability for property owner to select a system “off the shelf” or to work with an Engineer
Performance Standards • Nitrogen Tiers • PSN1 • 20,000 gpd or larger • 5 to 8 mg/l • PSN2 • Between 2,500 and 20,000 gpd • 12.5 mg/l • PSN3 • Less than 2,500 gpd • 20 mg/l
Performance Standards • Phosphorus Tiers • PSP 1 • 3.9 mg/L • Case-by-case for 20,000 gpd and larger • PSP 2 • 7.85 mg/l • Case-by-case for 2,500 – 20,000 gpd • Case-by-case determination based on: • Soil tests and • Groundwater P concentrations • Site has seasonal high water table above 27 inches