Download

1 / 39
390 likes | 393 Views
This study presents the results from the PHOBOS Experiment on the centrality dependence of charged particle pseudorapidity distributions in d+Au collisions at 200 GeV. The analysis methods and systematic data are discussed, along with comparisons to other collision systems. The centrality determination and particle spectra are also examined.

E N D
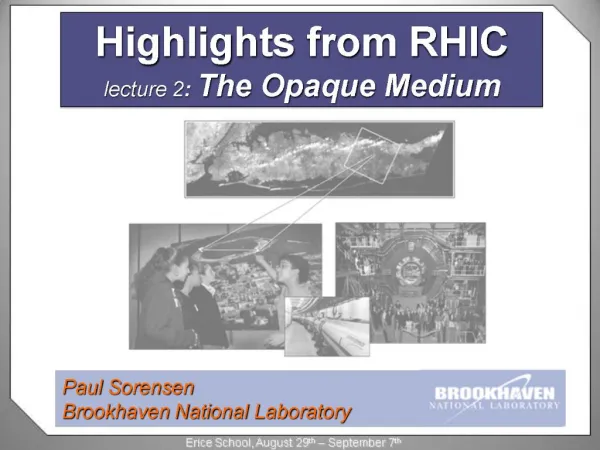
Multiplicity Results from PHOBOS Experiment Centrality Dependence of Charged Particle Pseudorapidity Distributions in d + Au Collisions at 200 GeV University of Illinois at Chicago and Brookhaven National Laboratory for the Collaboration Rachid NOUICER
PHOBOSCollaboration Birger Back,Mark Baker, Maarten Ballintijn, Donald Barton, Russell Betts, Abigail Bickley, Richard Bindel, Wit Busza (Spokesperson), Alan Carroll, Zhengwei Chai, Patrick Decowski, Edmundo García, Tomasz Gburek, Nigel George, Kristjan Gulbrandsen, Stephen Gushue, Clive Halliwell, Joshua Hamblen, Adam Harrington, Conor Henderson, David Hofman, Richard Hollis, Roman Hołyński, Burt Holzman, Aneta Iordanova, Erik Johnson, Jay Kane, Nazim Khan, Piotr Kulinich, Chia Ming Kuo, Willis Lin, Steven Manly, Alice Mignerey, Gerrit van Nieuwenhuizen, Rachid Nouicer, Andrzej Olszewski, Robert Pak, Inkyu Park, Heinz Pernegger, Corey Reed, Michael Ricci, Christof Roland, Gunther Roland, Joe Sagerer, Iouri Sedykh, Wojtek Skulski, Chadd Smith, Peter Steinberg, George Stephans, Andrei Sukhanov, Marguerite Belt Tonjes, Adam Trzupek, Carla Vale, Siarhei Vaurynovich, Robin Verdier, Gábor Veres, Edward Wenger, Frank Wolfs, Barbara Wosiek, Krzysztof Woźniak, Alan Wuosmaa, Bolek Wysłouch, Jinlong Zhang ARGONNE NATIONAL LABORATORY BROOKHAVEN NATIONAL LABORATORY INSTITUTE OF NUCLEAR PHYSICS, KRAKOW MASSACHUSETTS INSTITUTE OF TECHNOLOGY NATIONAL CENTRAL UNIVERSITY, TAIWAN UNIVERSITY OF ILLINOIS AT CHICAGO UNIVERSITY OF MARYLAND UNIVERSITY OF ROCHESTER 68 Collaborators; 8 Institutions; 3 Countries
PHOBOS Multiplicity Detector • 4p Multiplicity Array: • - Central Octagon Barrel : • - 6 Rings at Higher Pseudorapidity : • Triggering: Scintillator Counter Arrays Triggering “Scintillatorcounter arrays” RingCounters Octagon Sample Silicon Pad Sizes Octagon Detector: 2.7 x 8.8 mm2 Ring Counter: 20 –105 mm2
PHOBOS Charged Particle Multiplicity Analysis Event display of a 200 GeV Au+Au collision f Octagon region Rings Rings • Two analysis methods : • 1- Hit-Counting analysis based on ratio of hit pads to empty pads using Poisson statistics • 2- Analog analysis based on particle energy deposited in each pad
Extensive Systematic Au + Au Data Phys. Rev. Lett., 91, 052303 (2003) 200 GeV 19.6 GeV 130 GeV PHOBOS PHOBOS PHOBOS dN/dh Typical systematic band (90%C.L.) h h h • Phys. Rev. Lett. 85, 3100 (2000) • Phys. Rev. Lett. 87, 102303 (2001) • Phys. Rev. C 65 , 31901R (2002) • Phys. Rev. Lett. 88 , 22302 (2002) • Phys. Rev. C 65 , 061901R (2002) • Phys. Rev. Lett. 91, 052303 (2003) • nucl-ex/0301017, subm. to PRL • nucl-ex/0311009, subm. to PRL PHOBOS Multiplicity Papers :
Parton Saturation Describes Au + Au Kharzeev & Levin, Phys. Lett. B523 (2001) 79 Au + Au at 130 GeV • We need a simpler system such as d + Au in order to understand a complex system Au + Au • The results of d+Au are crucial for testing the saturation approach
Centrality Determination Comparison of the signal distributions from Data and MC (AMPT + Geant) ERing method 3 <|h | < 5.4 • Compare data to fully simulated & reconstructed AMPT + Geant including trigger and event selection effects See posters by R.Hollis Corr2 and A.Iordanova Corr3
Centrality Determination • Using simulation to estimate the trigger/event selection inefficiency for very • peripheral events Overall trigger and vertex-finding efficiency is ~ 83 %
Centrality Determination • Unbiased ERing signal distribution presents the full geometrical cross section • Slice this distribution into percentile bins • For each slice we extract dN/dh • Number of Participants: Npart
p + p at 200 GeV Preliminary For more details about pp see poster by J.Sagerer Spectra36 Pseudorapidity Distribution of Charged Particles in d + Au and p + p Collisions at 200 GeV • d + Au at 200 GeV Min-Bias nucl-ex/0311009 and Submitted to PRL
Pseudorapidity Distribution of Charged Particles in d + Au and p + p Collisions at 200 GeV • p + p at 200 GeV • d + Au at 200 GeV Min-Bias Preliminary nucl-ex/0311009 and Submitted to PRL • The total integrated charged particle multiplicity normalized to the number of participant in d + Au and p + p is approximately the same.
Pseudorapidity Distribution of Charged Particles in d + Au and p + p Collisions at 200 GeV • p + p at 200 GeV • d + Au at 200 GeV Min-Bias nucl-ex/0311009 and Submitted to PRL Preliminary • The total integrated charged particle multiplicity normalized to the number of participant in d + Au and p + p is approximately the same.
Centrality (Impact Parameter) Dependence of dN/dh for d + AuCollisions at 200 GeV Preliminary • High particle production • toward gold direction and increasing as function of centrality • PHOBOS has extensive dN/dh data on AuAu and now dAu, pp
Evolution of Nch/(Npart/2) vs Npart PHOBOS Preliminary pp & dAu • dAu data shows features similar to lower energy pA • Nch(dAu)=[(1/2)Npart] Nch(pp) Centrality Dependence of Total Nch • Evolution of Nch/Npp ratio vs Npart
Npart=257.3 124.5 65.9 15.5 8.1 4.2 2 Shape Dependence on Npart of Pseudorapidity Distribution AuAu dAu Preliminary pp Systematic errors are not shown • In dAu with increasing Npart, particle production shifts toward negative rapidities
Data and Parton Saturation model Latest KLN calculations Comparison dAu Minimium-bias to Parton Saturation (KLN), RQMD, HIJING and AMPT Models nucl-ex/0311009 and Submitted to PRL nucl-ex/0311009 and Submitted to PRL KLN calculations as of October 03 Parton saturation model predictions for d + Au: D. Kharzeev et al., arXiv:hep-ph/0212316 • The centrality dependence in d+Au is crucial for testing the saturation approach
Centrality Dependence Compared to Models Parton Saturation (KLN) and AMPT Models PHOBOS Preliminary AMPT predictions for d + Au : Zi-Wei Lin et al., arXiv:nucl-ph/0301025 • Centrality dependence is inconsistent with Saturation model (KLN) • AMPT cannot be ruled out
Limiting Fragmentation in dAu and pEmulsion Data • dAu & pEmulsion per incident nucleon and approx. same Npart • Compilation of world pEmulsion Ns + Ng data Npart Selection: p Em 1 2.4 d Au 1.6 1.6x2.4 • Energy independent fragmentation regions continue to cover wider and wider extent in h as energy increases
Limiting Fragmentation in dAu and pPb Data • dAu & pPb per incident nucleon and approx. same Npart Npart Selection: p Pb 1 3.5 d Au 1.83 1.83x3.5 • No accident: holds for bigger system such as pPb
Summary • PHOBOS has extensive dN/dh data on Au+Au and now p+p, d+Au • The total integrated charged particle multiplicity normalized to the number of participant in d + Au and p + p is approximately the same • dAu data shows similar features as lower energy p+A • Npart scaling of d+Au and p+A relative to p+p • with increasing Npart, particle production shifts toward negative rapidities • energy independent fragmentation regions continue to cover wider and wider extent in h as energy increases • Centrality dependence inconsistent with Saturation model (KLN) • AMPT cannot be ruled out
Five Distinct Silicon Centrality Methods for Cross Checks 2) EOct method | h | < 3 3) EAuDir method h < -3 1) ETot method | h | < 5.4 EOct ETot EAuDir Centrality methods 5) ERing method 3 <|h | < 5.4 4) EdDir method h > 3 EdDir ERing
Data HIJING Does HIJING Reproduce the Relative Bias like Data? Peripheral: 60-70% Most peripheral: 90-100%
Data HIJING Does HIJING Reproduce the Relative Bias like Data? Mid-Central: 30-40% Central: 0-10% Answer: Yes, HIJING Reproduces the Relative Bias as Data
Selecting the Best Trigger Cut Negative Pseudorapidity region ERing seems to be the best trigger cut HIJING
Selection the Best Trigger Cut Negative Pseudorapidity region ERing seems to be the best trigger cut HIJING
Nch vs Npart for Different Trigger cuts Data The best linear fit to the data resulting in the relation Nch vs Npart is given by ERing trigger cut
Missing charged particle multiplicity is Estimates of the Total Charged Particle Production Using AMPT Model Using Triple Gaussian fit • Upper limit including systematic errors : • Estimated total charged particle multiplicity is
Minimum-Bias dN/dh Obtained from the Five Distinct Silicon Centrality Methods The distributions agree to within 5% PHOBOS DATA PHOBOS DATA
Positive Paddles Negative Paddles NegativeCerenkov PositiveCerenkov Negative ZDC Positive ZDC d Au PN PP x z Second Analysis: Requiring at Least One hit in One of the Paddle Counters (Scintillator Counters arrays) Data HIJING
Correction Factor Distribution and Minimum-bias Distributions Minimum-bias distributions with and without correction Trigger and Vertex Bias corrections obtained from HIJING
Comparison between the two analysis methods Comparison between minimum-bias distributions obtained by silicon centrality methods and paddle counters
Comparison to Parton Saturation and RQMD Models nucl-ex/0311009 and Submitted to PRL • Parton saturation (KLN) and RQMD models are inconsistent with the data • KLN model overestimates the height of the gold side peak, underestimates its width, and predicts the peak at h ~ -3 rather than h= -1.9 as in data. Parton saturation model predictions for d + Au: D. Kharzeev et al., arXiv:hep-ph/0212316
Comparison to AMPT and HIJING Models nucl-ex/0311009 and submitted to PRL • The HIJING calculation • reproduces the deuteron side and the peak of the gold-side • fails to reproduce the tail in the gold direction (h < -2.5). • AMPT predictions • With & without final-state interactions fall close to the data. • FSI appear to broaden the gold-side peak, leading to moderate increase of the particle multiplicity in the region h < -3.5. AMPT predictions for d + Au : Zi-Wei Lin et al., arXiv:nucl-ph/0301025
Vertex Restriction → ‘Clean’ Events (T0P&T0N)||T0Single “De-bunched Beam” cleaned away with Vertex cut (Paddle Timing resolution not sufficient) T0P&T0Nn T0P&T0N&Vertex Collisions from different buckets T0N Time [ns] Counts T0P arm projection Run 10623 T0P Time [ns] T0P Time [ns]
Normalize Scale Centrality Determination Comparison of the signal distributions from Data and MC (HIJING) DATAmeasured cross section MC distribution with trigger and vertex bias • Data and MC (biased) distributions match well • - Data cut = MC cut X scale factor Scaling factor =1.046 Details of centrality determination were presented in DNP talks: A. Iordanova and R. Hollis at UIC
Centrality Determination • Using simulation to estimate the trigger /event selection inefficiency for very • Peripheral events Overall trigger and vertex-finding efficiency is ~ 83 %