Download
1 / 40
510 likes | 892 Views
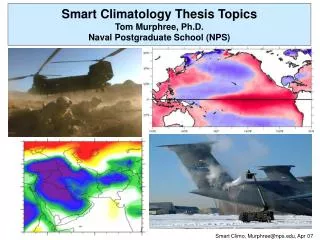
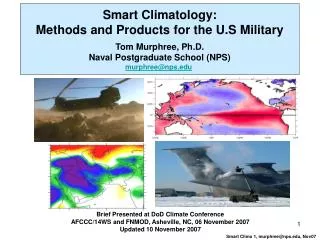
NPS Smart Climatology Brief. A Smart Climatology of Evaporation Duct Heights and Surface Radar Propagation for the Northwest Indian Ocean and Nearby Regions. Lt Katherine L. Twigg, Royal Navy Thesis Advisors: Dr. Tom Murphree and Paul Frederickson Naval Postgraduate School

E N D
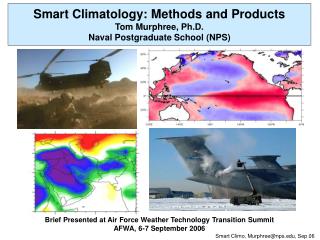
NPS Smart Climatology Brief A Smart Climatology of Evaporation Duct Heights and Surface Radar Propagation for the Northwest Indian Ocean and Nearby Regions Lt Katherine L. Twigg, Royal Navy Thesis Advisors: Dr. Tom Murphree and Paul Frederickson Naval Postgraduate School 07 September 2007 Unclassified
Summary • Author: Lt Katherine L Twigg, RN • Advisors: Tom Murphree and Paul Frederickson • Sponsor: Royal Navy; Office of Naval Research • Beneficiaries: Users of surface radar (e.g., for antisubmarine warfare, ship defense, special ops) • Methods and Results: • Used smart climatology data and methods to improve long term mean climatologies of evaporation duct heights (EDH) and radar propagation in the Indian Ocean and nearby seas. • Analyzed impactsof seasonal changes & climate variations (e.g., ENLN, IOZM) on EDH & surface radar propagation. • Results: (a) new smart EDH climatology with substantial improvements over existing Navy climatology; (b) identified major spatial and temporal changes in EDH, including those caused by climate variations; (c) determined which factors EDH and surface radar propagation are most sensitive to for different regions and seasons; (d) found potential for forecasting EDH and surface radar propagation at weekly to monthly lead times. • Products: (a) smart climatological environmental assessment surfaces for EDH and EDH factors; and (b) smart climatological performance surfaces for surface radar propagation (range, CoF); both for varying climate scenarios. • The methods used in this work are directly applicable to developing smart climatologies for other regions, and for other EM and acoustic propagation phenomena. Surface radar detection ranges (km) based on our smart EDH climatology. Values shown are long term means for Sep,for a C-band radar at 30 ft and detection threshold of 150 dB. EDH (m) from our smart EDH climatology. Values shown are long term means for Aug. Full thesis available at: NPS Smart Climatology Reports, http://wx.met.nps.navy.mil/smart-climo/reports.php
Outline • Introduction to EDH and its importance in EM propagation • Introduction to smart climatology process • LTM EDH plots and correlation to its factors • Comparison to existing climatology and WHIO buoy data • Effect of climate variations on EDH • Operational implications and application • Conclusions and future work
Evaporation Duct and EM Propagation Image courtesy of Maritime Warfare Center, RN Unclassified
Evaporation Duct Greatly extended detection ranges possible within evap duct • Evaporation ducts form just above the ocean surface due to the rapid decrease in humidity with height from saturation conditions at the surface. • The evaporation duct height (EDH) is the height in the surface layer where the vertical gradient in modified refractivity (M) changes from negative to positive. • EDHs can be highly variable in space and time. • The trapping layer below the EDH behaves like a waveguide and can lead to propagation at microwave frequencies over the horizon. Radar waves bend up EDH at min M Radar waves bend down Height Evaporation Duct Modified Refractivity
Evaporation Duct • It is not feasible to routinely measure vertical M profiles close to the surface, so EDH is determined from an evaporation duct (ED) model using bulk measurements. • NPS ED model is a ‘state of the art’ model and is used in our research. • Advanced Refractive Effects Prediction System (AREPS) computes propagation loss and uses ED models to create a low-altitude refractivity profile that is blended with refractivity data for higher altitudes. • Higher EDHs often lead to increased signal strength and radar detection ranges, depending upon the frequency, and the height of the radar and target. • EDH is the best parameter for quantifying near-surface microwave propagation. No Duct EDH = 10m EDH = 40m EDH = 30m EDH = 20m Height (m) Range (nm) AREPS Probability of Detection plots for 10GHz radar against a small surface target, for varying EDH
Factors Affecting EDH Unstable Unstable Stable Stable • Vertical distribution of humidity, which determines EDH, is dependant upon SST and turbulent mixing near the surface. • Thus, the main factors which determine EDH are SST, wind speed, air temperature, and humidity. • EDH is sensitive to the sign of the air-sea temperature difference (ASTD). Generally conditions are unstable (i.e., ASTD < 0). However, if ASTD > 0 EDH, increases rapidly. • EDH increases/decreases with increasing wind speed when ASTD is negative/positive. Increasing wind speeds cause surface conditions to be more neutral. • EDH is extremely sensitivity to the ASTD, especially at lower wind speeds and RH.
Smart Climatology Climate • Expected state of the environment based on scientific observations, analyses, theories, and models. Not based just on observational analyses. Expected state accounts for long term means and variations from these means that occur over long periods (e.g., anomalous trends and oscillations that occur over weeks, years, or longer). Smart Climatology Climatology applied to military uses that employs all relevant tools of modern climatology, such as: • Full suite of in situ and remote observational data sets • Reanalysis • Data access, mining, processing, and visualization tools • Modern statistical and dynamical analysis methods • Long term means and higher order statistics • Climate variations (e.g., regimes, trends, oscillations) • Climate system modeling • Statistical and dynamical climate forecasting Most smart climatology tools are not currently used by the US or UK military
Data Used NCEP Global Atmospheric Reanalysis • Area: Indian Ocean, with focus regions in areas of operational/academic interest. • Spatial resolution: Guassian grid ~210 km x 210 km (shown below). • Surface data: specific humidity, air temperature, skin temperature, u and v components of wind, pressure. • Timescale and temporal resolution: 1970-2006, every 6 hours. Blue shaded areas: focus regions. Yellow shaded areas: two existing Navy EDH climatology data squares.
Coastal EDH Issues • Reanalysis data at a given grid point is an average for a whole grid box. • Coastal grid boxes merge land and sea data. • EDH is dependent on surface factors which can change dramatically from land to sea. • EDH was calculated only for grid boxes lying exclusively over sea. • EDH was estimated for coastal grid boxes that include land and sea, using calculated EDH in nearest sea grid boxes. • Thus, EDH values near the coast should be used with caution. Example showing how sea grid points were mapped to land-sea grid points. EDH calculated for blue shaded grid boxes.
Results Examples: Smart EDH Climatology Long Term Mean EDH for May/Jun/Jul Long Term Mean EDH for Aug/Sep/Oct Cautionary note: see Coastal EDH Issues slide EDH unit: meters
Results Examples: Effects of Factors on EDH LTM SST for Aug/Sep/Oct LTM EDH for Aug/Sep/Oct LTM Ta for Aug/Sep/Oct LTM ASTD for Aug/Sep/Oct LTM WS for Aug/Sep/Oct LTM RH for Aug/Sep/Oct Cautionary note: see Coastal EDH Issues slide Units: EDH (m), WS (m/s), RH (%), Temperature (°C)
EDH and Factor Correlations Gulf of Aden – coastal example • EDH varies from ~ 10-75 m • EDH greatest in Jun/Jul/Aug • Many factors have similar (or mirrored) annual patterns. • EDH vs factor correlations show: • EDH has high correlation to ASTDthroughout the year. • RH strongly correlated May-Oct. • Air Temp strongly correlated Jan-May. • U-wind strongly correlated Sep-Nov. • Correlation value of 0.274 equates to a 95% significance level • Correlation value of 0.470 equates to a 99.5% significance level • EDH highly dependent on wind direction and advection of warm, dry air from the land. • Factor correlations identify key variables to monitor, analyze and forecast, and lead to improved estimates of uncertainty. EDH (m) Wind (m/s) Temp (°C) unstable unstable stable ASTD (°C) SW’ly Wind ENE’ly Wind RH % Correlation
EDH and Factor Correlations Diego Garcia – equatorial example • EDH varies from ~ 8-11 m • Biannual cycle, peaks in Feb & Jul. • Unstable conditions throughout • EDH vs factor correlations show: • EDH has high correlation to wind speedfor the entire year, wind speed dominates EDH cycle. • RH strongly correlated Jul - Nov. • Air Temp strongly correlated Mar-May and Oct -Jan. • U-wind strongly correlated Jun – Nov. • Correlation value of 0.274 equates to a 95% significance level • Correlation value of 0.470 equates to a 99.5% significance level. • EDH highly dependent on wind speed. • Factor correlations identify key variables to monitor, analyze and forecast, and lead to improved estimates of uncertainty. EDH (m) Wind (m/s) Temp (°C) ASTD (°C) NE’ly Wind RH % SW’ly Wind Correlation
Existing Climatology vs Smart Climatology • Existing climatology plotted in map view; normally only displayed in bar graph form. • Resolution • Plots highlight the benefit of higher resolution data and improve understanding of EDH variability. • Data • Existing climo data collected primarily along shipping routes. Some 10x10 grid boxes had ~100 observations, and some >3000. • Comparison • Some basic similarities, but clearly large differences in magnitude and spatial patterns. • EDH in Gulfs dissimilar due to ‘open ocean adjustment’ of Paulus-Jeske model. • Requirement for ‘ground truthing’ Smart EDH LTM Sep Existing EDH LTM Sep Cautionary note: see Coastal EDH Issues slide EDH units: meters
Existing Navy Climatology vs Smart Climatology 66 30 • Existing EDH climatology • Constructed in early 1980s from 1970-1979 COADS data. • COADs data primarily from volunteer ships of opportunity • LTM monthly values • Resolution: 10°x10° boxes (1000 km x 1000 km) • EDH computed using Paulus-Jeske ED model with “open ocean adjustment”. • Smart EDH climatology • Constructed in this study from NCEP reanalysis data. • Monthly mean of 6 hrly data. • Time periods: 1970-1979 &1970-2006. • Resolution: ~210 km x 210 km • EDH computed using NPS ED model. • Comparison • Smart climo comparison used average of 36 grid points covering the same area as existing climo. • Both climatologies show similar seasonal cycle. • Large magnitude differences due to differences in data and differences in model. Existing climo grid boxes: 10x 10 degree Marsden squares Existing Climo Smart Climo (1970-2006) Reanalysis Means (1970-1979)
EDH Climatologies vs EDH From In Situ Buoy EDH Monthly Means WHOI buoy Existing climatology Smart climatology 1994-1995 reanalysis • Existing climo box • Buoy location • Nearest reanalysis grid point • Buoy, existing climo, smart climo, and 1994-1995 reanalysis monthly means should not necessarily be the same, as they do not represent the same areas and time periods. • So there is no one absolute truth. • However, the values should be similar. • Buoy: one point in space for one year, located where the Somali Jet position, structure, and strength will have a distinct effect on observations in the vicinity. • All EDH data sets show similar temporal variations. • Existing climo consistently has highest values. • Smart climo and 1994-1995 means generally have better agreement with the buoy than existing climatology. • Worst agreement with buoy is Jul/Aug when Somali Jet is strongest.
Correlation of Diego Garcia EDH with Large Scale EDH Factors Oct-Dec Correlation to SST Oct-Dec Correlation to 850Z • Local EDH significantly correlated with remote factors. • Fluctuations in remote factors are indications of global scale climate variations. E.g.: • Correlation with SST and 850 hPa geopotential height indicate Diego Garcia EDH is strongly correlated with El Nino-La Nina (ENLN) and Indian Ocean Zonal Mode (IOZM). • Thus, we hypothesized that climate variations cause significant deviations from the LTM EDH values. Images created at NOAA/ESRL Physical Sciences Division web site at using NCEP reanalysis data.
Climate Variations – Indian Ocean Zonal Mode (IOZM) IOZM -ve IOZM +ve • Coupled ocean-atmosphere oscillation in the Indian Ocean (IO). • Positive Phase: • Anomalous surface E’ly winds over equatorial IO. • Anomalous cooling of SE IO and anomalous warming of W IO. • Enhanced (reduced) convection over the western (eastern) IO. • Negative phase often follows/ precedes positive phase. • Negative Phase: opposite configuration to positive phase. • Dipole Mode Index (DMI) is a measure of IOZM. • Positive phase often coincides with El Nino event Images from :http://www.jamstec.go.jp/frsgc/research/d1/iod/
ENLN and IOZM Indices and Event Selection --- IOZM index (DMI, 5 month smoothed) --- ENLN index (MEI, 5 month smoothed) IOZM: Aug-Oct is period of high amplitude and large anomalies in IO. ENLN: Oct-Dec is period of high amplitude and large anomalies in IO. Developed composites based on top 5 IOZM and ENLN events. MEI from http://www.cdc.noaa.gov/people/klaus.wolter/MEI/index.html
Composite Results: Positive IOZM Anomalies Vector Wind +IOZM Anomaly ASO SST +IOZMAnomaly ASO RH +IOZMAnomaly ASO Wind Speed +IOZMAnomaly ASO Units: EDH (m), WS (m/s), RH (%) Temperature (°C)
Composite Results: Positive IOZM Anomalies ASTD +IOZMAnomaly ASO EDH +IOZM Anomaly ASO RH +IOZMAnomaly ASO Wind Speed +IOZMAnomaly ASO Cautionary note: see Coastal EDH Issues slide Units: EDH (m), WS (m/s), RH (%) Temperature (°C)
EDH Anomalies: Seasonal Composite vs Single Month • Comparison of 5-event composite seasonal anomaly to a single month anomaly during a strong +IOZM event. • Similar patterns, but magnitudes ~3x larger in single month anomaly. • Opposite anomalies in Gulf of Oman and other areas. This highlights complex nature of the impacts of climate variations on EDH. EDH +IOZM Composite Anomaly ASO EDH Anomaly Sep 1997 -10 10 -3 3 Cautionary note: see Coastal EDH Issues slide Units: EDH (m)
Correlations of EDH with Climate Variations - Examples • Colors show significant correlations • warm colors: positive correlation. • cool colors: negative correlation. • dark colors: 95% significance. • EDH lags climate variations by 0,1, and 2 months. • Correlation varies with the climate variation, location, and season. • EDH often lags the climate variation by 1-2 months. • Thus, EDH variations may be predictable at medium to long range lead times. IOZM ENLN
Climatological Sensor Performance Impacts • Figure to left shows how radar propagation strength decreases with range for different EDHs. • Radar at 20m, target at 5m. • APM propagation model used. • Propagation loss at a given range decreases as EDH increases • Greater EDH: less propagation loss, greater detection range. • Thus, detection range will vary as EDH varies. • Example: C-band radar detection ranges for Sep LTM & Sep 1997, shown in climatological sensor performance surfaces, or maps, below: Cautionary note: see Coastal EDH Issues slide
Key Results • Produced improved LTM EDH • Increased data time period and temporal resolution. • Increased spatial resolution from 1000 x 1000 km to 210 km x 210 km. • Generated map displays • EDH correlated to different factors in different seasons and locations • Factor correlations identify key variables to monitor, analyze and forecast, and lead to improved estimates of uncertainty. • Where upwelling occurs stable conditions do not necessarily result in increased EDH. • EDH varies with climate variations (e.g. IOZM, ENLN) • Spatial and temporal variations, with varying significance levels. • Climate variations impact EM detection ranges. • EDH often lags the climate variation by 1-2 months, thus EDH and surface ranges may be predictable at medium to long range lead times . • Proof of concept: use of smart climatology for environmental and performance assessments. • Demonstrated value of smart climatology for improving military climatologies • Caveats and limitations • Coastal issues. • Detection ranges are based on evaporation duct only and does not account for surface-based ducts.
Future Work • Use higher spatial resolution data. • Improved dynamical understanding and coastal values. • Investigate finer temporal effects. • Accounting for diurnal effects should increase correlation significance. • Construct conditional climatologies based on different climate regimes (e.g., strong wind vs light wind regimes). • Investigate ‘smarter correlations’ (e.g., correlations with offshore/onshore winds). • Further analyses of climate variation impacts. • Include North Atlantic Oscillation, Madden-Julian Oscillation, monsoon effects, different ENLN magnitudes, combined ENLN & IOZM years. • Develop correlation plotting tools for user-selected data (e.g., EDH vs IOZM, ENLN). • Potential to predict EDH and surface radar ranges based on climate variations (ref: Hanson & Moss theses). • Develop forecaster rules of thumb. • More local analysis, including backward smart climatology methodology. • Ground truth results. • Extend smart climatological process to full atmospheric M profiles. • Thus enabling detection range prediction during seasons of subsidence and prediction at any height. • Use smart climatological approach to develop an improved global EDH climatology. • Extend methodology to optical and acoustic climatologies and sensor performances.
A Smart Climatology of Evaporation Duct Heights and Surface Radar Propagation for the Indian Ocean and Nearby Seas Any Questions? Acknowledgements Bob Creasey, Mary Jordon, Arlene Guest, Bill Little
Contact Information Katherine Twigg, Lt, Royal Navy Fleet Numerical Meteorology and Oceanography Center Stop 1, 7 Grace Hopper Avenue Monterey, CA 93943-5598 Voice: 831-656-4096 katherine.twigg.uk@navy.mil Tom Murphree, Ph.D. Department of Meteorology Naval Postgraduate School 254 Root Hall, 589 Dyer Road Monterey, CA 93943-5114 Voice: 831-656-2723 Fax: 831-656-3061 murphree@nps.edu Paul Frederickson Department of Meteorology Naval Postgraduate School 254 Root Hall, 589 Dyer Road Monterey, CA 93943-5114 Voice: 831-595 5212 Fax: 831-656-3061 pafreder@nps.edu The full thesis is available at: NPS Smart Climatology Reports http://wx.met.nps.navy.mil/smart-climo/reports.php
Motivation • Investigate seasonal and anomalous variations in the air / sea boundary layers of the Indian Ocean (IO) and their effects on electromagnetic propagation via EDH variations. • Aim to provide tactical advice to naval command and operators on radar/ electronic support measure /communication propagation. • Our study is designed to: • enhance understanding of long term mean climatological EDH variations primarily in the northwest Indian Ocean, • hopes to provide the METOC/HM community with tools to predict how the EDH varies on medium to long timescales. • Primary analysis conducted using atmospheric and oceanographic reanalysis data composited for the anomalies of interest, and then EDH height calculated using the NPS EDH model (used in AREPS). • Individual case studies to highlight operational impacts and ground truth conclusions.
Thesis Approach Goal: • Determine sensitivity of EDH and radar propagation in NWIO to climate variations. Data sets: • NCEP/NCAR reanalysis, • SODA reanalysis, etc. Analysis methods and models: • Smart climatology: composite analysis and correlation analysis to identify how the seasonal cycles of the major atmospheric-oceanic factors that determine EDH are altered by ENLN, IOZM, MJO. • Use of EDH model and AREPS to assess sensitivity of EDH and radar propagation to climate variations. • Decision analysis models to develop tools for aiding military decision makers; etc. • Anticipated results / products: • Analyses of EDH factors, EDH, and radar propagation by season and by climate variation type; prototype operational products for use in military planning.
Evaporation Duct Height Figures show how EDH varies with changing RH (left) and changing (wind speed). The lower figure shows error on EDH for one set of conditions • EDH determined by Modified Refractivity M • T (K) : atmos temper, p (hPa) : total atmos pressure: e (hPa) : water vapor pressure. Ref: Fredrickson et al,01
Evaporation Height • Error Graphs for differing wind speed situations
Correlation of Diego Garcia EDH with Large Scale EDH Factors L L H H Weaker RSJ Stronger westerlies Decreased HOA & IO Precipitation 850hPa Geopotential Height for Anomalous Convection in Maritime Continent (La Nina) LaJoie Thesis, Mar06. Image provided by the NOAA/ESRL Physical Sciences Division, Boulder Colorado from their Web site at using NCEP reanalysis data
Climate Variations – Indian Ocean Zonal Mode (IOZM) Trigger: thermocline &/or wind Shallow thermocline E’ly wind anomaly Cool SST anomaly off Java by upwelling Increased SST gradient towards the W • Coupled ocean-atmosphere oscillation in the Indian Ocean (IO). • Positive Phase: • Anomalous surface E’ly winds over equatorial IO. • Anomalous cooling of SE IO and anomalous warming of W IO. • Enhanced (reduced) convection over the western (eastern) IO. • Negative phase often follows/ precedes positive phase. • Negative Phase: opposite configuration to positive phase. • Dipole Mode Index (DMI) is a measure of IOZM. • Positive phase often coincides with El Nino event Ocean-atmos feedbacks in the E IO controlling the growth of the IOZM + Positive Dipole Mode http://www.jamstec.go.jp/frsgc/research/d1/iod/ Meyers et al, 2007 J Climate,20, p 2872
Climate Variations – IOZM 1997/1998 event Diagram of the sequence of events in 97-98. a. The climatological alongshore winds off Sumatra (E) and the east African coast (F). The winds observed in the late summer and early autumn are denoted by G and H, respectively. The right-hand panel shows the effect at the Equator on the upper ocean induced by increased upwelling in the east and decreased upwelling in the west. b. Distribution of the winds resulting from the anomalous SST gradient along the Equator and the changes in the SSH distribution. • Formation of the Ekman ridge in the central Indian Ocean and the forcing of westward-propagating downwelling equatorial Rossby waves to the west. The right-hand panel shows the effect on the upper ocean near 58 S. d. Subsequent cooling of the western Indian Ocean through enhanced mixing and coastal Ekman transports from stronger than average monsoon winds and through circulation changes associated with the weakening of the 1997±98 El Nino. ‘Hypothesis adds a coupled dynamical component that has a longer timescale than the thermodynamics of the mixed layer, and which may form a link from one monsoon season to the next. Suggests that the Indian Ocean may not be a passive player in climate variability on seasonal to interannual timescales, but may enact a very active and independent role.’ Webster et al.,1999 NATURE |VOL 401 | 23 http://webster.eas.gatech.edu/Papers/Webster1999a.pdf
Climate Variations: El Nino–La Nina (ENLN) • Magnitude of the global fluctuations during El Nino and La Nina are second only to those of the seasonal cycle. • Occur about every 2 to 7 years. • Usually last about one year, starting in May-Jun of one year and lasting until the following May-Jun. • For EN events, the basic chain is: • Pacific subtropical highs become anomalously low and/or tropical – southeast Asian Pacific lows become anomalously high. • Pacific trade winds become anomalously weak. • Sea surface temperature (SST) becomes anomalously cool (warm) in western (eastern) tropical Pacific. • Tropical convection become anomalously weak (strong) in western (eastern) tropical Pacific. • Energy, moisture, and momentum transports into and out of the tropical Pacific becomes anomalous in many ways. • Phase & magnitude measured by variety of climate indices eg Multivariate ENSO Index (MEI) • La Nina: sequence approx opposite Dr Murphree, Modern Climatology Module16
Compositing Results: DMI+ Anomaly Air Temp DMI+ Anomaly ASO EDH DMI+ Anomaly ASO RH DMI+ Anomaly ASO SST DMI+ Anomaly ASO Cautionary note: see Coastal EDH Issues slide Units: EDH (m), WS (m/s), RH (%) Temperature (°C)
Sensor Performance Impacts Cautionary note: see Coastal EDH Issues slide