Download
1 / 4
40 likes | 155 Views
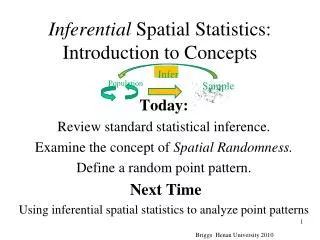
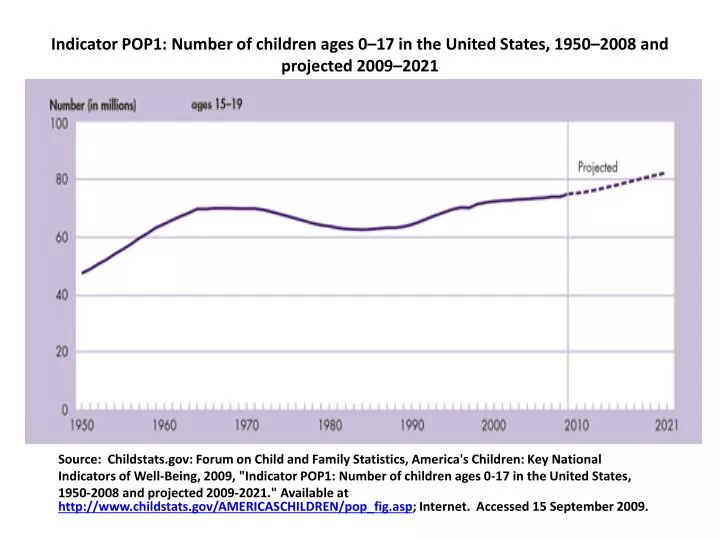
Indicator POP1: Number of children ages 0–17 in the United States, 1950–2008 and projected 2009–2021. Source : Childstats.gov: Forum on Child and Family Statistics, America's Children: Key National

E N D
Indicator POP1: Number of children ages 0–17 in the United States, 1950–2008 and projected 2009–2021 Source: Childstats.gov: Forum on Child and Family Statistics, America's Children: Key National Indicators of Well-Being, 2009, "Indicator POP1: Number of children ages 0-17 in the United States, 1950-2008 and projected 2009-2021." Available at http://www.childstats.gov/AMERICASCHILDREN/pop_fig.asp; Internet. Accessed 15 September 2009.
STATISTICS SAMPLE: Investment and Revenue per child – 1960, 1983, 2009