Download
1 / 44
440 likes | 632 Views
The Atmospheric Pollution and the Economic Development in China. Outline. Introduction and overview of the current state of the atmospheric pollution in the Asia-Pacific region Sulfur dioxide (SO 2 ) pollution in China Carbon dioxide (CO 2 ) pollution in China Concluding remarks. Overview.

E N D
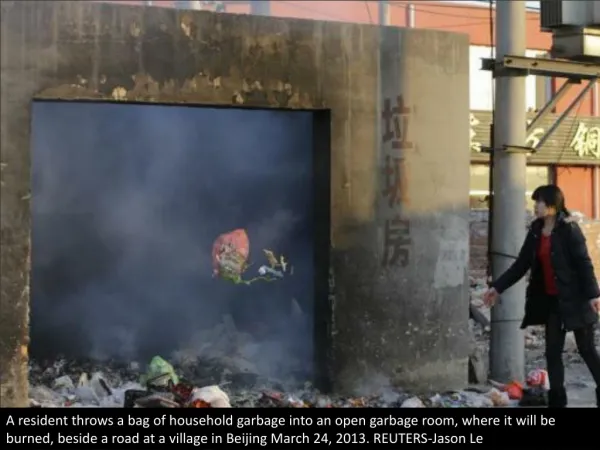
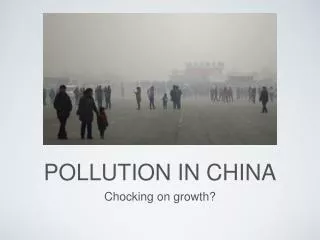
The Atmospheric Pollution and the Economic Development in China
Outline • Introduction and overview of the current state of the atmospheric pollution in the Asia-Pacific region • Sulfur dioxide (SO2) pollution in China • Carbon dioxide (CO2) pollution in China • Concluding remarks
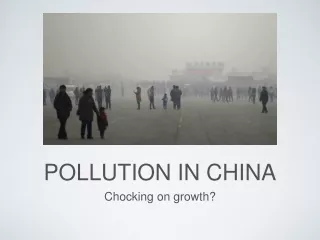
Overview • Atmospheric pollution increased significantly in the last three decades due to: • Rapid economic growth • More widespread use of motor vehicles
In the Asia-Pacific region... • In 1992, the region accounted for 21% of the world’s commercial energy consumption (shown in Fig 1) • Energy consumption grew by 6.2% while the global energy consumption fell by 1% • 80% of the energy generated by fossil fuels, 40% of which was coal
Fig 2: Relative Severity of Air Pollution in Asian Sub-regions
In the Asia-Pacific region... Con’d • Sulfur oxide emission increased by 80% (1970-1986) • Sulfur dioxide emission was 50% higher than either Africa or Latin America • Nitrogen oxide emission increased by 70% (1970-1986) • Carbon dioxide grew 60% faster than elsewhere
In the Asia-Pacific region... Con’d • Energy demand will double every 12 years (the world average: 28 years) • Demand for coal will remain high (6.5% annual increase) thanks to: • The abundance of coal • Its easy recoverability • SO2 emission triple in the next 12 years
The result… • A significant increase of national and trans-boundary acid deposition • Aggravating urban air pollution • Irreversible ecosystem damage with far-reaching implications… • In a word, the result is pretty darn BAD!!!
Sulfur dioxide (SO2) pollution • Generated as a result of the burning of coal and petroleum • When released into the air, it reacts with atmospheric water and oxygen to produce sulfuric acid – major component of acid rain
The acid rain… • Has substantially harmful effects on forests, fresh water and soils • Kills off insect and aquatic life forms • Causes chemical weathering to statues and buildings
SO2 in China… • In 2005, over 50% of SO2 emitted from the “Production and Distribution of Electric Power and Heat Power Industry” (11.67 million tonnes) • In which 11.12 million tonnes were the result of “Firepower Electricity” generation
Fig 5: Total Electricity and Firepower Electricity (1 Billion kwh)
Fig 6: Percentage of Firepower Electricity in Total Electricity Output
A couple of examples… • June 8, 2004, the SO2 pollution in Guiyang resulted in a “black dust storm”. • Nov. 12, 2004, an SO2 accident in Yichang hospitalized 108 persons.
Any optimism here?......Yes! • A study of national income and SO2 emissions in 12 Western European countries in 2006 • Used 132 years of data • Came up with an “Environmental Kuznets Curve” (EKC)
Fig 7: Kuznets Curve Income Inequality or Environmental Quality Income per capita
Fig 9: Predicted Sulfur Emissions Per Capita and Income Per Capita
Compare with the current Chinese situation… • The 2006 income per capita in China is $1,500 • Compared to the Western Europe turning points of $11,900 with regulations, and $12,200 without regulations
Fig 11: Per capita income and industrial SO2 emission (1995-2004)
Carbon Dioxide (CO2) Pollution • Atmospheric concentration of CO2 is mainly caused by: • Fossil fuel combustion • Deforestation • A vicious domino effect: SO2 emission → Acid rain →Deforestation →High atmospheric CO2 concentration→Greenhouse Effect & Global Warming
In 2002 UN statistics… • U.S. was the largest CO2 emitter (24.3%) • European Union (15.3%) • China (14.5%) • India, Japan and South Korea ranked No.4, 5, and 9 respectively • Canada ranked No. 8
Fig 16: Sectoral contribution to Greenhouse Gases emission (2000)
This is a classic free-rider problem. Remember?! I taught you the damn thing in Econ 328! Dear Prof. Peter Ibbott The reason? • Widespread awareness of the problem was relatively recent • Costs of pollution were born externally
Also a Prisoner’s Dilemma… Consider two groups of countries facing the following choices: • Neither group adopts environmentally friendly policies (EFP). Outcome: all economies grow rapidly because no resources are diverted to pollution abatement or prevention; but a very bad environment. • Group A adopts EFP, Group B doesn’t. Outcome: Group A becomes disadvantaged in the global economic competition; but a better environment. • Group B adopts EFP, Group A doesn’t. Outcome: Group B becomes disadvantaged in the global economic competition; but a better environment. • Both groups adopt EFP. Outcome: no one is economically disadvantaged; the best environment among the four choices.
Solution… • A coercive authority or a third-party organization, e.g. government and the UN • Kyoto Protocol • To stabilize CO2 and five other Greenhouse Gases concentration in the atmosphere at a level that would prevent dangerous anthropogenic interference with the climate system.
Under Kyoto Protocol… • Developed countries • Obligated to reduce GHG emission to a certain level by 2012 • Developing countries (including China) • Do not have the obligation of emission reduction
CO2 pollution in the near future… • Not so optimistic: • China has passed the EU and become the second largest CO2 emitter in the world • China is building one coal-fired power plant every week (unsubstantiated) • Not China’s fault? (yet to be evidenced)
The bright side… • Initiatives have been taken: • Scientific perspective of development (科学发展观) by President Hu Jintao • 30 environmental regulations & 375 environmental standards by central government • Over 900 environmental standards by local governments • 95,000 staff in 8,400 departments mobilized to monitor and enforce these regulations
Concluding remarks • Al Gore in An Inconvenient Truth: “We got everything we need [to better our environment], save perhaps, political will…” • A will to even sacrifice the current relative economic advantage • The environmental issue is not an economic issue so much as a political issue
A better environment… We hope that, with their excellence in leadership and statesmanship, the political leaders in the world will make this happen. And we’re counting on them.