Download
1 / 29
290 likes | 408 Views
Investigation of Charge Multiplication in Silicon Strip Detectors 20 th RD50 Workshop 30.05.- 01.06.2012. Lokman Altan , T. Barvich, F. Bögelspacher, W. de Boer, A. Dierlamm, K.-H. Hoffmann, R. Eber, A. Nürnberg, P. Steck. Overview. Introduction Overview of sensor properties

E N D
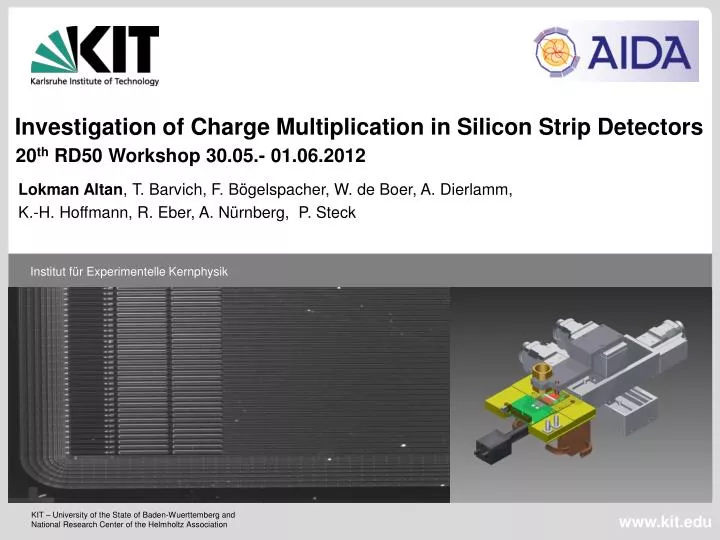
Investigation of Charge Multiplication in Silicon Strip Detectors20th RD50 Workshop 30.05.- 01.06.2012 Lokman Altan, T. Barvich, F. Bögelspacher, W. de Boer, A. Dierlamm, K.-H. Hoffmann, R. Eber, A. Nürnberg, P. Steck
Overview • Introduction • Overview of sensor properties • Qualification before and after irradiation • IV/CV measurement • Interstrip measurement • Bias resistance and coupling capacitance • Charge collection before and after irradiation • CCE • Signal to noise ratio • Leakage current • Summary
RD 50: Sensor Properties (p-Type) Geometry Depth (d = 150 µm, 305 µm, 675 µm) Width/pitch (0.075 < w/p < 0.75) Interstrip Active area: 10.18 mm x 11.76 mm Processing Diffusion time Implantation energy Irradiation Irradiation with protons and/or neutrons Variation of fluence Annealing time Lokman Altan
RD 50: Selected Sensors (p-Type) Geometry Depth (d = 150 µm, 305 µm, 675 µm) Width/ pitch (0.075 < w/p < 0.75) Interstrip Active area: 10.18 mm x 11.76 mm Processing Diffusion time Implantation energy Irradiation Irradiation with protons and/or neutrons Variation of fluence (1*1015, 5*1015, 1*1016 neq/cm2) Annealing time Lokman Altan
Irradiation with Protons • p100_w70_a: pitch 100µm, width 70µm, a: fluence F= 1*1015 neq/cm2 • Depth: 305µm • Choose different fluences • Irradiation with protons in Karlsruhe (23MeV protons) • Irradiation with neutrons in Ljubljana (finished and ready to measure) • Standard processing: no change of diffusion time and implantation energy
Qualification before and after irradiation with protons: CV-measurement w70 w33 • p100-sensors • blue: no irradiation green: F= 1*1015 neq/cm2 red: F= 5*1015 neq/cm2 black: F= 1*1016 neq/cm2 noirradiation: Vdep~ 100V irradiated : Vdep > 1000V w10
Qualification before and after irradiation with protons: IV-measurement w70 w33 • p100-sensors • no irradiation, F= 1*1015 neq/cm2, F= 5*1015 neq/cm2,F= 1*1016 neq/cm2 • @ T=-20°C: 1.4*10-18 A/cm (outlier: p100_w10_c) expected parameter (M.Moll): @ T=-20°C: 0.9*10-18A/cm w10
Qualification before and after irradiation with protons: interstrip-measurement • p100-sensors • Interstrip resistance Rint • Rint decreases with fluence • Interstrip capacitance Cint • Cint increases with w/p-ratio • Cint for two strips (only for one neighbor)
Qualification before and after irradiation with protons: coupling capacitance & bias resistance • p100-sensors • Coupling capacitance CC • CC: 2-2.5 (pF/cmµm) before and after irradiation • Bias resistance RBias • After irradiation RBias increases about 30% • RBias higher with increasing fluence
Annealing Measurement ALiBaVa-Measurement 90Sr source Cuts Seed: S/N > 5 Neighbors: S/N > 2 Temperature: -20°C Voltage: 150V – 1000V in 50V steps After each annealing step, a voltage ramp has been measured After last step: only four voltage values have been measured CCE Signal to noise ratio Leakage current Setup and Annealing
Measurement Results Pitch = 100 µm
p100_w70_a: Complete Measurement • ALiBaVa measurement • T= -20°C • 100'000 Trigger • Landau-Gauß-Fit
Charge Collection Efficiency (CCE), Pitch=100µm • no Charge Multiplication recognizable • 1015 neq/cm2: signal increases after short annealing time (beneficial annealing) and after long annealing time signal decreases (reverse annealing) • 5*1015 neq/cm2: only small dependence of charge collection on annealing time
Histogram: 1*1015 neq/cm2 vs. 5*1015 neq/cm2 600V, 1015neq/cm2 600V, 5*1015neq/cm2
Signal to Noise (s/n) • No difference between course of signal/noise and CCE • s/n increases with w/p-ratio • 5*1015 neq/cm2: small value, sometimes below limit of s/n = 5
Leakage current • Leakage current decreases with annealing time (as expected) • Leakage current increases with higher fluence and smaller w/p value
Measurement Results Pitch = 80 µm
Charge Collection Efficiency (CCE), pitch 80 µm • signal increases after short annealing time (beneficial annealing) and after long annealing time signal decreases (reverse annealing) • charge multiplication recognizable at smallest w/p ratio (p80_w6) repeat measurement
Charge Collection Efficiency (CCE), pitch 80 µm • CCE decreases with time at a constant voltage • Measurement was repeated always the next day • More current “less” CCE
Charge effect • Effect has also be seen in nonirradiated condition • Signal was measured from 1000V to 50V • Signal decreases with time
Signal to Noise (s/n) • No difference between course of signal/noise and CCE • s/n increases with w/p ratio • Directly ramped to 900V: s/n increases after last annealing step • Complete ramp: no increase directly ramped to 900V complete voltage ramp
Leakage current • Leakage current decreases with annealing time • Directly ramped to 900V: Current increases after last annealing step • Complete ramp: no increase directly ramped to 900V complete voltage ramp
Summary • Increased charge collection for a short duration at high voltage (900V) and a fluence of 1015 neq/cm2 • Signal to noise and leakage current also increase for a short time • This effect has to be understood (perhaps more measurement with Edge - TCT) • No Charge Multiplication at a fluence 5*1015 neq/cm2 so far • Next step: measuring samples after neutron irradiation • Dependence on processing will be investigated • Sensors already measured in non irradiated condition Thanks for your attention
Qualification before and after irradiation with protons: interstrip resistance Rint w70 w33 • p100- sensors • no irradiation, F= 1*1015 neq/cm2, F= 5*1015 neq/cm2,F= 1*1016 neq/cm2 • Rint increases with width/pitch (w/p)- ratio • Rint decreases with fluence • coefficient ~1000 between irradiated and non- irradiated samples w10
Qualification before and after irradiation with protons: interstrip capacitance Cint w70 w33 • p100- sensors • no irradiation, F= 1*1015 neq/cm2, F= 5*1015 neq/cm2,F= 1*1016 neq/cm2 • Cint increases with w/p- ratio • Cint for two strips (only for one neighbor) • Cint increases a little bit after irradiation (except p100_w70_a) • after irradiation the permittivity changes w10
Qualification before and after irradiation with protons: bias resistance RBias w70 w33 • p100- sensors • no irradiation, F= 1*1015 neq/cm2, F= 5*1015 neq/cm2,F= 1*1016 neq/cm2 • after irradiation RBias increases about 30% • RBias higher with increasing fluence • RBias scatters after irradiation w10
Qualification before and after irradiation with protons: coupling capacitance CC w70 w33 • p100- sensors • no irradiation, F= 1*1015 neq/cm2, F= 5*1015 neq/cm2,F= 1*1016 neq/cm2 • CC higher for increasing w/p- ratio • is almost constant in non- irradiated condition • after irradiation CC increases a little w10
Histogram: 1*1015 neq/cm2 vs. 5*1015 neq/cm2 300V, 1015neq/cm2 300V, 5*1015neq/cm2