Download
1 / 23
240 likes | 452 Views
Blood Transfusion Public Health Risk to Explore Limitations of the Common Risk Matrix. Shabnam Vatanpour. Outline. Background Objectives Methods Results Conclusions. Risk Management ISO International Standard. Risk Assessment. Risk Matrix * U.K. National Health Service Guidance.

E N D
Blood Transfusion Public Health Risk to Explore Limitations of the Common Risk Matrix Shabnam Vatanpour
Outline • Background • Objectives • Methods • Results • Conclusions
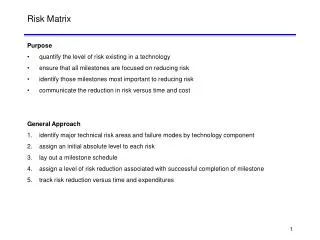
Risk ManagementISO International Standard • Risk Assessment
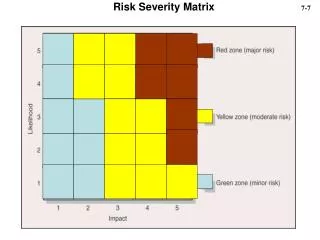
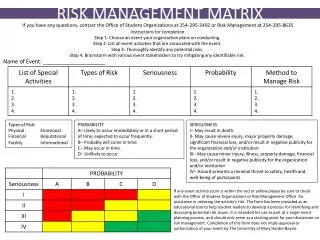
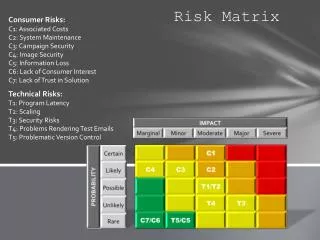
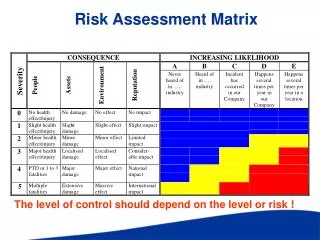
Risk Matrix*U.K. National Health Service Guidance Simple to use Consistent Capable of assessing a broad range of risks Simple to adapt to meet specific needs
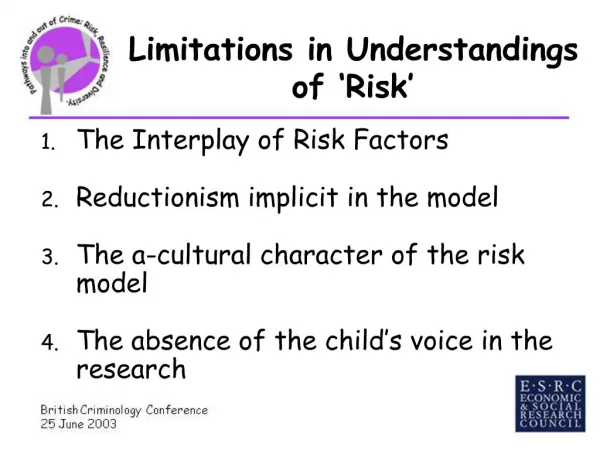
Cox’s Concerns Ambiguous inputs and outputs Poor resolution Sub-optimal allocation of resources In some situations, worse than a random guess
Cox’s Theoretical Example Risk = Frequency × Severity where Frequency = 0.75 – Severity (for severity between 0 and 0.75) 0.5 1 0 1 0.5 0
Negative Correlation Frequency Severity [0,0.25] → [0.5,0.75] Medium [0.25,0.5] → [0.25,0.5] Low [0.5,0.75] → [0,0.25] Medium • Risk (Frequency × Severity) = F × S • Risk (0.45, 0.3) =0.13 → Low risk • Risk ( 0.32,0.43) =0.14 → Low risk • Risk (0.1, 0.65)=0.07 →Medium risk • Risk (0.55, 0.2) =0.11 → Medium risk Risk Low Medium Medium Frequency
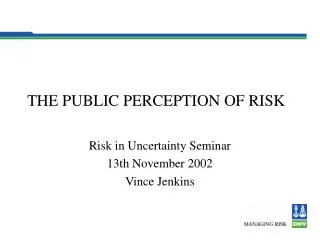
Objective Evaluation of risk matrix • using a public health risk scenario tainted blood transfusion risk • when frequency and severity are negatively correlated
Severity and Frequency of Blood Infectious Diseases in Canada, 1987-1996
Results Negative correlation Spearman correlation: -0.81 Logarithmic transformation log-Risk = log-Frequency + log-Severity Relationship between frequency and severity log-Severity = 0.24 log-Frequency2 + 1.01 log-Frequency +1.99 Risk function estimation log-Risk = 1.99 + 2.01 log-Frequency + 0.24 log-Frequency2
Epstein-Barr virus Cytomegalovirus TT virus HIV SEN virus Syphilis CJD/vCJDC Hepatitis G Hepatitis B HTLV Bacterial Contamination Hepatitis C Risk = Frequency x Severity
Blood Infectious DiseasesRisk Matrix Observed risk: Risk = Frequency × Severity Estimated risk: log-Risk = 1.99 + 2.01 log-Frequency + 0.24 log-Frequency2 Risk Color Coding †Risk estimation based on the fitted risk function ‡Observed risk based on the risk generic function
Risk Estimation Risk{(Hep B,10-5, 103)} = 0.01 Low Risk Risk{(TT, 0.3, 10)} =10 Low Risk Risk{(Ep. Barr, 0.9, 100)} = 79Medium Risk Higher risk diseases tend to have higher risk ranks in the risk matrix.
Epstein-Barr virus Cytomegalovirus TT virus HIV SEN virus Syphilis CJD/vCJDC Hepatitis G Hepatitis B HTLV Bacterial Contamination Hepatitis C Generating Data Generated data 4 Generated data 2 Generated data 3 Generated data 1
Blood Infectious DiseasesRisk Matrix Observed risk: Risk = Frequency × Severity Estimated risk: log-Risk = 1.99 + 2.01 log-Frequency + 0.24 log-Frequency2 Risk Color Coding †Risk estimation based on the fitted risk function ‡Observed risk based on the risk generic function
Risk Estimation Generated Data Risk{(Hep B,10-5, 103)} = 0.01 Low Risk Risk{(TT, 0.3, 10)} =10 Low Risk Risk{(Data 2, 0.00021, 103)} = 0.21 Medium Risk Risk{(Data 4, 0.005, 100)} = 0.5Medium Risk Higher risk diseases tend to have lower risk ranks in the risk matrix for some scenarios.
Conclusions • Careful reconsideration of uses of the risk matrix in risk management • Use risk matrix outputs as an operational input to risk management decision-making, • Avoid risk matrix outputs to drive or even become the risk management decision.
Reference • Cox LA Jr. What's wrong with risk matrices? Risk Anal. 2008; 28(2):497-512. • Government of Alberta. 2012. Drinking Water Safety Plan Training Course. Alberta Environment and Sustainable Resource Development. http://environment.gov.ab.ca/info/library/8691.pdf • Hrudey, S.E., E. J. Hrudey. 2004. Safe Drinking Water - Lessons from Recent Outbreaks in Affluent Nations. London, IWA Publishing. • Hrudey, S.E., D. Krewski. 1995. "Is there a safe level of exposure to a carcinogen?" Environ. Sci. Technol.29(8), 370A-375A. • Hrudey, S.E. 1995. “Major concerns with quantitative cancer risk assessment for environmental risk management: North American experience.” Process Safety Environ. Protect. - Trans. I. Chem. E.73, Part B, S24-S27. • Hrudey, S.E. 1998. “Quantitative Cancer Risk Assessment - Pitfalls and Progress.” Issues in Environmental Science and Technology.Eds. R.E. Hester and R.M. Harrison 9: 57-90, Roy. Soc. Chem. Pub., Cambridge • Hubbard, D., D. Evans. 2010. Problems with scoring methods and ordinal scales in risk assessment. IBM Journal of Research & Development. 54(3): 2:1-2:10. • ISO 2009. International Standard: Risk management – Risk assessment techniques. IEC/ICO 31010. Edition 1.0 2009-11 • Kaplan S, Garrick BJ: On the quantitative definition of risk. Risk Analysis. 1981, 1:11-27. • Levine, E.S. 2012. Improving risk matrices: the advantages of logarithmically scaled axes. Journal of Risk Research. 15(2): 209-222. • NHMRC. 2011. Australian Drinking Water Guidelines. National Health and Medical Research Council. Canberra, ACT. http://www.nhmrc.gov.au/guidelines/publications/eh52 • NHS NPSA 2008.A Risk Matrix for Risk Managers. National Patient Safety Administration, National Health Service. London, U.K. • Pickering, A., S. Cowley. 2010. Risk matrices: implied accuracy and false assumptions. Journal of Health & Safety Research & Practice. 2(1): 9-16. • Queensland Health 2012. Implementation Standard for Use of the Risk Analysis Matrix. Standard #QH-IMP-070-2:2011. • Quintella, M.C., M. Addas-Carvalho and M.G.C. daSilva. 2008. Evaluation of the risk analysis technique in Blood Bank Production Processes. Chemical Engineering Transactions. 13: 271-278. • Risk Management: Principles and Guidelines. 2009. Available at: http://www.iso.org/iso/catalogue_detail?csnumber=43170 . Accessed • Rodricks, J.V. 2007. Has quantitative risk assessment been of benefit to the science of toxicology? 2006 American College of Toxicology distinguished service award lecture. International Journal of Toxicology 26: 3–12. • TBC 2013. Treasury Board Secretariat of Canada. Guide to Corporate Risk Profiles. http://www.tbs-sct.gc.ca/tbs-sct/rm-gr/guides/gcrp-gepropr-eng.asp?format=print • US DOT 2006. Risk Assessment and Allocation for Highway Construction Management. Federal Highway Administration. U.S. Department of Transport. October 2006 http://international.fhwa.dot.gov/riskassess/index.cfm • WHO 2012. Rapid Risk Assessment of Acute Public Health Events. World Health Organization. WHO/HSE/GAR/ARO/2012.1 http://www.who.int/csr/resources/publications/HSE_GAR_ARO_2012_1/en/index.html • WHO 2011. Guidelines for Drinking-Water Quality. 4th Edition. World Health Organization. Geneva. Switzerland. http://www.who.int/water_sanitation_health/publications/2011/dwq_chapters/en/index.html • Wieland, B., S. Dhollander, M. Salman and F. Koenen. 2011. Qualitative risk assessment in a data-scarce environment: A model to assess the impact of control measures on spread of African Swine Fever. Preventive Veterinary Medicine. 99: 4-14. • Public Health Agency of Canada, Transfusion Transmitted Diseases/Infections. 2012. Available at: http://www.phac-aspc.gc.ca/hcai-iamss/tti-it/ttdi-eng.php