Download

1 / 24
250 likes | 514 Views
Confounding And Interaction. Dr. L. Jeyaseelan Department Of Biostatistics CMC, Vellore. Case Study. Is goiter related to high altitudes?. A group of researchers presented data showing rate of goiters between two areas that were different in altitudes.

E N D
Confounding And Interaction Dr. L. Jeyaseelan Department Of Biostatistics CMC, Vellore
Is goiter related to high altitudes? • A group of researchers presented data showing rate of goiters between two areas that were different in altitudes. • There was a higher rate of goiter among people who lived in counties located at high altitudes. • Hence the researchers concluded that living at high altitudes was a factor associated with presence of goiter. PDQ Epidemiology
Is goiter related to high altitudes? Distance to reach high altitudes Iodine evaporates before reaching high altitudes….
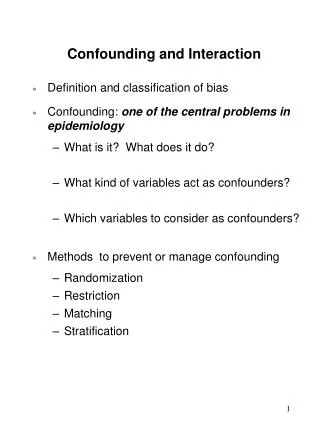
Definition What looks like a causal relationship between a supposed hazard and a disease may be due to another factor not taken into consideration. This additional factor is called a confounder, something that confuses the correct interpretation of data. GAMBLING CANCER Unobserved association True causation SMOKING ALCOHOL OTHER FACTORS
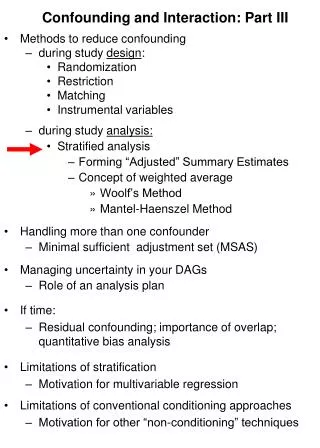
E Fig A D F BASIC CONCEPTS IN ASSESSMENT OF RISK Situations in which F is a confounder for a disease- exposure association. ( ) non- causal association; ( ) causal association. The letters E Exposure F Potential matching factor (confounder) D Disease Fig A. Indirect association between exposure and disease that is due to the factor F. Example: Association between drinking alcoholic beverages (E) and Lung cancer (D) would likely be explained in terms of an association between alcohol intake and cigarette smoking (F). James. J. Schlesselman, 1982
E Fig B D F Situation in which matching on a factor F is proper Fig B. E and F individually alter the risk of disease and are also associated. Failure to match or otherwise control for F in this instance would result in a biased assessment of the individual effect of E. Example: Use of oral contraceptives and cigarette smoking are both risk factors for myocardial infarction. Note: OC use and smoking are positively associated, so that failure to adjust for the effect of smoking (F) results in an overestimate of the effect of the OC use (E) on the risk of a myocardial infarction. James. J. Schlesselman, 1982
E E D D F F Fig C Fig D Situations in which F is not a confounder for a disease- exposure association. Fig C Example: A case control study of venous thromboembolism and blood group O provides an example of avoiding unnecessary matching. Although age and sex are characteristics that bear a strong relationship to disease, they are practically unrelated to the factors is necessary Fig D Example: Hospital based case control study on Myocardial infarction (MI) and oral contraceptives. James. J. Schlesselman, 1982
E E D D F F Situations in which F is not a confounder for a disease- exposure association. James. J. Schlesselman, 1982
Confounding: • Apparent association is due to another variables • - Apparent lack of association could result from failure to control for the effect of some other factor. Example: The following table shows the recent oral Contraceptive (OC) use (last use within the month before admission) among 234 cases of MI and 1742 controls. OC MI Control Yes 29 135 No 205 1607 Odds ratio = 1.68 (Shapiro et al 1979)
Table: age-specific Relation of MI to Recent oral Contraceptive (OC) use
Table : Summary of Examples Showing Confounding and/or Interaction in Randomly Sampled Data Page (246); David G. Kleinbaum 1982
MANTEL-HAENSZEL METHOD OF COMBINING 2 * 2 TABLES ² = 5.26 > 3.84 Reject H0 The null hypothesis of interest is: H0 : PLESS = PMORE Vs Ha : PLESS P MORE 95% CI (1.11 to 6.71 )
However, these data were collected in two clinics and then combined. The data for the individual clinics are shown below together with some summary statistics. Conclusion is s that there is no association between amount of prenatal care and one-month infant survival. This contradicts our previous conclusion. Why?
Suitable methods have been suggested by Mantel and Haenszel 1. To test the null hypothesis that on the average there is no association. 2. To measure the average strength of the association. The formulas for the individual tables is Where With indicating summation over all strata or tables. XMH2 approximately has the chi-square distribution with 1 d.f.
With the continuity correction, The pooled estimate of the odds ratio is given by: With indicating summation over all strata or tables.
Example: For the prenatal care data: Clinic 1 Clinic 2
Table1: Baseline characteristics of 2188 children with non-severe pneumonia randomised to 3 days or 5 days of treatment with amoxicillin. Values are numbers (percentages) of patients unless stated otherwise
Table1 (Cont….) *Z score given as number of standard deviations from normal value. †Rate above the age specific cut off RSV=respiratory syncytial virus.