Download
1 / 34
340 likes | 468 Views
Korea University – May 14, 2008. What Are the Economic Health Costs of Non-Action in Controlling Toxic Water Pollution? by K. William Easter, Professor Department of Applied Economics University of Minnesota. Problem 1. Many new toxic chemicals being produced in U.S.

E N D
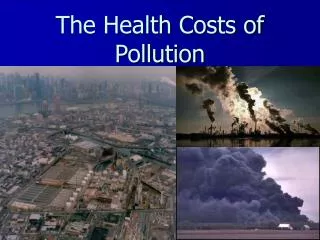
Korea University – May 14, 2008 What Are the Economic Health Costs of Non-Action in Controlling Toxic Water Pollution? by K. William Easter, Professor Department of Applied Economics University of Minnesota
Problem • 1. Many new toxic chemicals being produced in U.S. • 2. Limit public information available in U.S.on possible health effects of new “toxic chemicals” • 3. Little attention given to estimating costs of toxic chemical contamination in water bodies • 4. Economic health cost estimates will be dependent on: • Composition of water demand – human vs. environmental • Information given the public • Action of private and public agents
B. Objectives 1. Review methods for estimating costs 2. Discuss how information and behavior affects choice of method or methods 3. Use six different “scenarios” with different chemicals and countries to illustrate choices Developed vs. developing countries Three pollutants: arsenic, mercury and atrazine 4. Consider effect of new arsenic standard in Minnesota 5. Suggest strategies for reducing costs of contamination
C. Methods for estimating costs 1. Avoidance cost – need information and options 2. Recreational choice – for nondomestic uses 3. Cost-of-illness if health is impaired – works best for illnesses that can be completely cured 4. Contingent valuation for domestic uses – information about pollution level and effects are critical includes pain and suffering 5. Very few earlier studies (tables 1, 2 and 3)
Table 1. Economic Cost of Toxic Pollution of Drinking Water Supplies Per Household
Table 2. Economic Cost of Toxic Pollution of Water Used for Recreation
Table 3. Economic Cost of Microbial or Mineral Contamination of Drinking Water
D. Two country settings • 1. Developed country – i.e., U.S. and Japan • 2. Developing country – i.e., Bangladesh and India • E. Three toxic contaminants • 1. Arsenic – naturally occurring in groundwater • 2. Mercury – emissions and discharges from coal-fired plants, mining, and some chemical firms • 3. Atrazine – heavily used herbicide in U.S. agriculture but banned in some EU countries
F. Arsenic 1. Naturally occurs in soil and water around the world including Minnesota 2. Inorganic arsenic poses health risks in drinking water – skin, bladder and lung cancer 3. U.S. arsenic standard change from 50 μg/L to 10 μg/L in 2001 4. U.S. communities had until 2006 to meet new standard 5. High levels in groundwater in parts of India, China and Bangladesh
G. Mercury 1. Big sources – coal-fired plants, gold mining, and selected industries 2. Consumption of methylmercury from fish can cause cancer, heart attacks and brain damage, etc. 3. U.S. allowed greater emission levels for coal-fired plants. Health cost to Minnesota residents will be $190 million 4. New Delhi, India's groundwater has high levels of mercury 5. Minamata disease (mercury poisoning) from Minamata, Japan (industrial discharge)
H. Atrazine 1. Widely used herbicide on U.S. corn and soybean (Figure 2-1) 2. Banned in many countries in EU. 3. Persists in soil and gets in groundwater 4. Disagreement and debate over whether it is a carcinogen
I. Summary of pollutants’ effects 1. Arsenic (inorganic) – acute/immediate and chronic health risks and death at high doses 2. Mercury (methylmercury) – can cause cancer, heart attacks, permanent brain damage, etc., especially bad for children 3. Atrazine – was classified as possible human carcinogen but is now listed as not a likely carcinogen by USEPA
Developing country cost estimation • 1. Information and options limited Can user afford options? • Can’t use avoidance costs • 2. Recreation low priority • Developed country cost estimation • 1. Many have information and options • Do public agencies report contamination? • The greater the contamination the longer U.S. communities delay reporting (Konishi) • 2. Recreation important • Is this true for Korea? • 3. Best method will vary (table 4)
Table 4. Best Method for Estimating Welfare Costs of Non-Action
L. Future costs and concerns 1. Arsenic serious future costs for Asia a. Bangladesh 60% of population may be affected b. Need low cost filters or other cheap alternatives 2. Mercury serious future costs for world a. Increasing emissions of coal-fired plants: 1,500 tons annually with 870 tons from Asia b. High fish consumption – Asia and Pacific c. Are Japanese deaths from mercury just the beginning for Asia? 3. Atrazine’s full impact still uncertain 4. Can small U.S. communities meet new arsenic standard cost effectively? 5. Developing countries have biggest risk (table 5)
Table 5. Potential Future Cost of Not Controlling or Mitigating Toxic Pollution
M. Treatment of arsenic in small Minnesota communities 1. A little more than 30 small Minnesota communities didn’t meet new standard in 2001 (figure 1) 2. Cost per capita for small communities is high – economies of size (table 6) 3. Questions we asked ● Are the benefits of meeting the new standard greater than the costs? ● Do costs and benefits differ by community size? ● What alternatives do small communities have for meeting new standard?
N. Surveyed Minnesota communities to estimate benefits 1. Sample 1,040 persons from 30 communities 2. Communities varied in size: under 500, 500 – 1,000, and over 1,000 3. Asked willingness to pay to meet new standard 4. Response rate 51% after three mailings (table 7)
Table 7. Distribution of Survey Responses* *Sample was 100 to 120 for each of the 9 categories. **Arsenic level above standard currently and historically on average. ***Only above standard historically on average.
P. Factors significantly affecting WTP estimates* 1. Perception of water safety in terms of arsenic contamination 2. Level of arsenic – those with levels above the standard are willing to pay more. 3. Age (over 60) and education in some models ______________ *10% or higher.
Q. Factors with little or no significant effect on WTP estimates 1. Household income -- positive* 2. Children under 7 years of age in the household -- positive*3. Use of bottled water or home treatment devices (averting behavior) – negative*4. Community size __________________* These variables may be insignificant because they are correlated with perception.
Table 8. Estimated Median Annual WTP by Community Size and Level of Arsenic Contamination
Table 10. Estimated Cost Per Household for Private Home Treatment**
Table 11. Per Capita Annual Costs and Benefits of Meeting New Standard
Estimate of willingness to pay (WTP) • 1. WTP estimates don’t vary by community’s size. • 2. WTP estimates for small communities are below costs. • 3. However, about one quarter of sample may have WTP above $135 • 4. Some in sample have already paid more than $135. • 5. Still benefit-cost ratio for small comunities is under one.
S. Conclusions for Minnesota study 1. For some small rural communities in the U.S. the new standard may not be an improvement. 2. Communities should have more options to meet standard. 3. However, about one quarter of sample may have WTP about $135 4. Population must be fully informed about the arsenic risks if household treatment is used. 5. Current U.S. EPA variance to meeting the standard is seldom asked for or granted. 6. Variance requires towns to operate and maintain household devices.
T. Overall strategies for controlling toxic pollutants 1. Improve monitoring and detection efforts worldwide 2. Provide consumers better information regarding water quality and options 3. Develop low cost filters, etc., for arsenic 4. Strengthen and enforce mercury pollution emission standards worldwide5. Develop improved substitutes for Atrazine 6. Require water suppliers to report any toxic pollution immediately
URL to access presentation: http://www.apec.umn.edu/faculty/weaster/