Download
1 / 16
160 likes | 274 Views
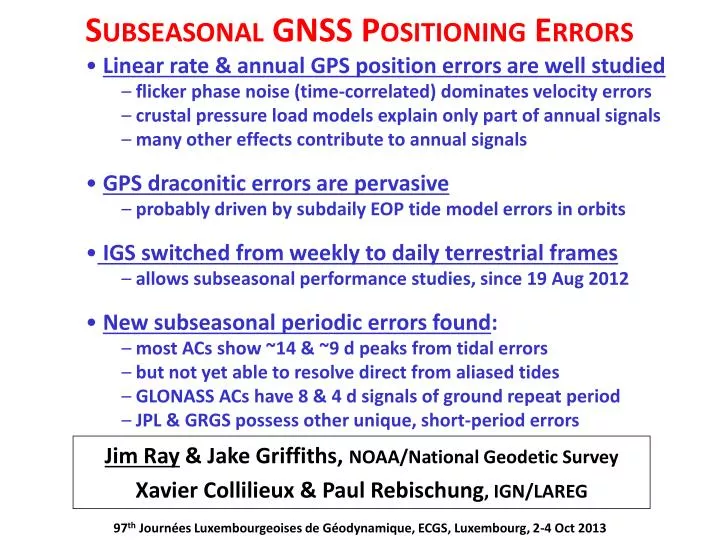
Linear rate & annual GPS position errors are well studied flicker phase noise (time-correlated) dominates velocity errors crustal pressure load models explain only part of annual signals many other effects contribute to annual signals GPS draconitic errors are pervasive

E N D
Linear rate & annual GPS position errors are well studied • flicker phase noise (time-correlated) dominates velocity errors • crustal pressure load models explain only part of annual signals • many other effects contribute to annual signals • GPS draconiticerrors are pervasive • probably driven by subdaily EOP tide model errors in orbits • IGS switchedfromweekly to dailyterrestrial frames • allows subseasonal performance studies, since 19 Aug 2012 • New subseasonalperiodicerrorsfound: • most ACs show ~14 & ~9 d peaks from tidal errors • but not yet able to resolve direct from aliased tides • GLONASS ACs have 8 & 4 d signals of ground repeat period • JPL & GRGS possess other unique, short-period errors Subseasonal GNSS Positioning Errors Jim Ray & Jake Griffiths, NOAA/National Geodetic Survey Xavier Collilieux & Paul Rebischung, IGN/LAREG 97thJournées Luxembourgeoises de Géodynamique, ECGS, Luxembourg, 2-4 Oct 2013
Background: Long-term GPS Position Spectra • From IGS weekly combined • frame residuals, 1996 - 2006 • Background spectraobey • flicker phase noiseprocess • position errors time-correlated • some white noise at highest frequencies Raw IGS Stacked Spectra dU annual + 1stdraconitic semi-annual + 2nddraconitic dE dN flicker noise (slope = -1) 3rd, 4th, 5th, 6thdraconitics White Noise • Periodic spectral peaks at: • annual + semi-annual periods • harmonics of GPS year (N * 1.04 cpy) • Surface crustalfluidloadsexplain • only part of annualsignals • ~50% for dU, ~20% for dN, ~10% for dE • other effects: GPS draconitic harmonics, • thermal expansion & tilting, IERS model • deficiencies, antenna & receiver effects, • analysis effects, etc Flicker Phase Integer Power-Law Noise Types (time domain) Random Walk Flicker Frequency Integrated Random Walk 02
Harmonics of GPS Draconitic Year are Pervasive (from X. Collilieux et al., 2011) dE • GPS-sun geometry repeat period • “draconitic” year = 351.4 d • 1st & 2nd harmonics overlap • seasonal signals • IGS station coordinates (2006) • in all dNEU components • harmonics up to at least 6th • Later found in all IGS products: • “geocenter” variations • polar motion rates (esp 5th & 7th) • LOD (esp 6th) • orbit day-boundary jumps (esp 3rd) • Strong fortnightly signals also common, but Nyquist limited for • past IGS station coordinates • Periodic signals clearer in reprocessed results dN % of GPS Stations dU Frequency (cycles per year) 03
Possible Origins of Draconitic Signals • 1) Local multipath effect at stations • station-satellite geometry repeats every sidereal day, approximately • 2 GPS orbital periods during 1 Earth inertial revolution • • actual GPS repeat period = (1 solar day - ~245 s) • • sidereal period (K1) = (1 solar day - 235.9 s) • for 24-hr sampling (e.g., data analysis), alias period → GPS draconitic year • 2) Mismodelling effect in satellite orbits • empirical solar radiation parameters intrinsically linked to orbital period • implies large-scale spatial correlations of station draconitics • Hypothesis: errors in a priori IERS model for subdaily EOP tidal • variations absorbed into GPS orbits • EOP tide errors resonate with GPS orbital period & efficiently absorbed • GPS ground repeat period (near K1) aliases errors to draconitic year • 6 GPS orbital planes cause beating and overtone harmonics • IERS model is known to have errors at the 10 to 20% level, equivalent to about 2 cm @ GPS altitude • errors also alias into EOP estimates & presumably station coordinates 04
Example of Harmonic Fit: AMC2 (Colorado, USA) • IGS Repro1 time series residuals • these are weekly GPS positions • remove model loads (red dots) • fit harmonic model of ann + semi- • ann + 1st thru 6thdraconitics • (turquoise line) • Beating of ann/semi-ann with • 1st/2nddraconitics can explain • inter-annual amp variations • esp for dN & dE • fits are often quite significant (for • stations with ≥ 250 weeks) • Post-fit residuals often approach • previously inferred noise floors: • 0.65 mm WRMS for weekly dN • 0.7 mm WRMS for weekly dE • 2.2 mm WRMS for weekly dU annual fit local temperature 05
Compare Annual & 1st Draconitic Amplitudes 1stDraconitic units = mm annual & draconitic estimated simultaneously GPS minus Load Raw GPS >10 years of weekly data Annual Raw GPS GPS minus Load 06
Global Distribution of 4th dN & dU Draconitics • Strong spatially correlated patterns • not consistent with a local origin • implies draconitic errors involve orbits • GPS constellation: • inclination = 55° • RA longitudes = 17°, 77°, 137° , …, 317° 07
midnight PM discontinuities Evidence for Subdaily EOP Tide Model Errors • 1) Aliases in IGS polar motion rate discontinuity spectra • compute midnight discontinuities in IGS polar motion time series • IGS Repro1 data (10 Mar 2005 – • 29 Dec 2007) • most spectral peaks match subdaily alias lines (Kouba, 2003) • demonstrated with comparison between IERS2013 model & • HFEOP VLBI (from J. Gipson) • also some odd draconitics • (via orbits) daily noon PM offset & rate estimates subdaily EOP alias lines • 2) Differences among subdaily EOP models • EOP tide models based on • GOT4.7 & TPXO7.1 also differ • from IERS2013 by 10 to 20% • courtesy of R. Ray (2009) HFEOP-IERS2003 model diffs 08
Spectrum of IGS midnight orbit discontinuities • Compare to simulation using subdaily EOPs with ~20% errors • Effects on station coordinates not studied Impact of Subdaily EOP Tide Errors on GPS Orbits Power Density (mm2 / cpd) IGS orbits EOP error impact simulation • subdaily EOP tide errors alias into orbits in bands near 14, 9, & 7 d periods • other major features at near-annual & 3rddraconitic periods Frequency (cycles per day) 09
First Look at Daily IGS Position Spectra • Stack spectra of 306 daily stations from 20 Aug 2012-13 Jul 2013 • Unsmoothed FFTs use ≥ 256 days per station • Continuum noise very close to flicker process down to ~2.6 d • White noise floor below ~2.6 d • Tidal lines visible near: • ~13.5 ± 0.8 d • ~9.7 ± 0.35 d • Cannot yet resolve: • direct tide errors • 13.63/13.66 d & • 9.12/9.13 d • not expected but • reported by others • subdaily EOP aliases • 14.19/14.77 d & • 9.6/9.37 d • expected • Possible additional • peak at ~8.0 d IGS Daily Combined Coordinates 10
COD + ESA + GFZ (GPS + GLO) GLONASS Repeat Period Seen in GNSS AC Spectra • GLONASS groundrepeat • periodis 8 d • (17 orbits, each11h 15m) • 8.0 d peak visible in spectra • of GPS+GLO ACs (CODE + • ESA + GFZ = 474 AC stations) • Possible harmonics too: • 2nd at 4.0 d • 3rd at 2.67 d • No such peaks seen in • spectra of GPS-only ACs • (MIT + NGS + EMR = 419 AC • stations) • But these ACs also have • more high-frequency noise • GLONASS data previously • found to degrade EOPs MIT + NGS + EMR (GPS only) 11
Unexplained 3.7 d Peak for GRGS • Similar processing as for other ACs, for 114 daily stations • Likely tidal peak at ~13.5 d; perhaps also at ~9.7 d • GRGS includes GLONASS data but no peak near 8.0 d • probably heavily deweight GLONASS data compared to GPS • GRGS uniquely shows • strong, sharppeakat • ~3.7 d • seen in all components • no corresponding • peak seen in GRG vs • IGS orbit differences • No explanation yet • for this feature • but peak is close to • half of GRGS analysis • week = 3 hr + 7 d + 3 hr • = 7.25 d • perhaps a bug or subtle • constraint effect GRG only (GPS + GLO) 12
Unlike other ACs, JPL’s daily frames not usable to assess • subseasonal performance because of disjoint network design • So instead use daily time series at JPL’s sideshow website • stack periodograms for 183 station time series, each with ≥80% days during • 1998.0 – 2012.0 (annual + semi-annual terms removed) • Find unique broad band • of power around ~5.5 d • signal visible in 2-yr subsets • some stations stronger • than others • previously reported by • Amiri-Simkooei (2013) • who suggested quasi- • periodic effects • more likely to be aliased • ~24-hr EOP tide errors • beating with JPL 30-hr arc • other ACs use 24-hr arcs • (except GRGS) • if so, aliases of ~12-hr EOP • tide expected at 2.5 to ~3 d Unexplained ~5.5 d Band for JPL JPL only (GPS) ~5.5 d ? 13
JPL has Direct & Aliased Fortnightly Tide Lines • Direct (13.63 d) & subdaily aliased (14.76 d) tidal lines both seen • but, unlike other ACs, only in dN & dE, not dU • Amiri-Simkooei (2013) found lines at 13.63, 14.2, 14.6, & 14.8 d but did not • discuss • Amiri-Simkooei used multivariate method that does not distinguish • position components, so missing dU lines were not seen • JPL’s fortnightly behavior • is distinct from other ACs • & difficult to explain • but could be sensitive • only to rotational errors • if EOPs use 24 hr arcs • Unique sharp line at • ~7.38 d • only in dE, not dN & dU • perhaps related to JPL • orbit week, 7.25 d • or maybe alias of µ2 • tide errors • by why dE only? JPL only (GPS) 14.76 d 7.38 d 13.63 d 14
Conclusions • IGS now producing daily combined & AC terrestrial frames • permits subseasonal error analysis, since 19 Aug 2012 • Most ACs show fortnightly signals in all components • ~9 d signals also likely, at least for some ACs • JPL is unique with only dN & dE fortnightly signals, not dU • direct vs aliased subdaily tidal sources not yet resolvable • subdaily EOP tidal aliases expected from polar motion rate analysis • Errors in IERS subdaily EOP tide model also likely to generate • pervasive GPS draconitics • due to efficient coupling into orbits, then aliasing to longer periods • GPS+GLONASS ACs show ~8 d signals in all components • ~4 d signals also likely • probably effect of GLONASS ground repeat period • GRGS & JPL show unique short-period features • strong 3.7 d line for GRGS & 7.38 d line for JPL unexplained • broad 5.5 d band for JPL probably alias due to 30-hr arcs 15