Download
1 / 27
270 likes | 272 Views
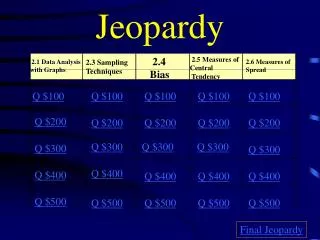
Jeopardy. Histograms . Normal Distribution. Z-Scores. Confidence Intervals. $100. $100. $100. $100. $100. $200. $200. $200. $200. $200. $300. $300. $300. $300. $300. $400. $400. $400. $400. $400. $500. $500. $500. $500. $500. Final Jeopardy. 1 - $100.

E N D
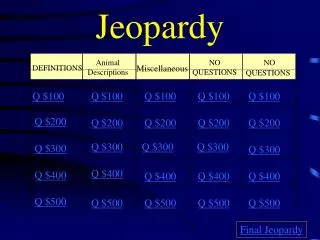
Jeopardy Histograms Normal Distribution Z-Scores Confidence Intervals $100 $100 $100 $100 $100 $200 $200 $200 $200 $200 $300 $300 $300 $300 $300 $400 $400 $400 $400 $400 $500 $500 $500 $500 $500 Final Jeopardy
1 - $100 • A histogram displays this type of information • Quantitative/Numerical
1 - $200 • This is an appropriate bin width for a data set referring to money • 20
1 - $300 • The graph if frequency distribution produced by joining the midpoints of intervals in known as what? • Frequency Polygon
1 - $400 • Which year had the most severe earthquakes? • 2008
1 - $500 • Given the following frequency table, draw the histogram. Bonus 100 pts: What is the shape? • Left Skewed
2 - $100 • This rule applies to the percentages of data within various standard deviations of a normal distribution. • 68-95-99.7 Rule
2 - $200 • Normal Distributions are referred to in terms of these measurements. • Mean, μ, and standard deviation, σ
2 - $300 • Describe the shapes of these density curves. • A: Skewed right, B: Bi-modal, C: Uniform
2 - $400 • No, does not follow 68-95-99.7 Rule
DAILY DOUBLE 2 - $500 • The length of beetles follows a normal distribution with an average length of 2.526mm and standard deviation 0.482. What percentage of beetles have a length less than 3.008mm? • 84%
3 - $100 • What does a z-score indicate? • The position of an individual in a data set on a standard normal distribution relative to the mean.
3 - $200 • State the formula to find the z-score for an individual in a data set that follows a normal distribution
3 - $300 • 0.202
3 - $400 • 0.8471
3 - $500 • The sales at McDonald’s between 12am and 5am follow a normal distribution, with an average sale of $6.23, and standard deviation $0.75. What percentage of customers spend more than $5.00? • 95.73%
4 - $100 • The likelihood that the result for the true population lies within a given range is what? • Confidence Level
4 - $200 • As we increase the sample size these decrease. • Margin of Error and Confidence Interval
4 - $300 • A recent report indicated that Canadians spend an average of 18.1 hours/week online. The results were accurate within 3.38 hours, 19 times out of 20. What is the confidence interval and confidence level?
4 - $400 • A recent survey found that 82% of the sample population drove to work each day, accurate within 5.2% 9 out of 10 times. If the target population is 124’000, what would the confidence interval be?
4 - $500 • Recent survey on recycling within a municipality indicated that a target population of 52’000 had between 40092 to 42068 individuals recycling regularly. What was the confidence interval and margin of error for the sample population?
5 - $100 • Find the measures of central tendency for this data set: 5, 7, 7, 8, 9, 10, 10, 10, 11, 12, 13, 16 • Mean: 9.8 • Median: 10 • Mode: 10
5 - $200 • This measure is strongly affected by outliers • Mean
5 - $300 • If you are given the sum of the squares of the deviations in a data set, what are the next steps in finding the standard deviation? • Divide by sample size, n, take the square root.
5 - $400 • Calculate the standard deviation of this data set 20, 26, 25, 24, 31, 38, 36, 34, 33, 27, 32, 35, 25, 38, 19, 37, 24, 40
5 - $500 • Find the standard deviation from the following frequency table • σ = 12.02
Final Jeopardy • Given the two normally distributed data sets below for the prices of homes in each city, which house has a greater relative value: one sold in Edmonton for $392 000 or one sold in Calgary for $417 000? • Edmonton, because the z-score is higher than that for Calgary