Download
1 / 51
530 likes | 577 Views
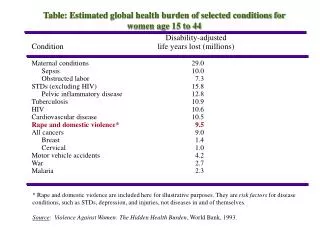
Global Health: The Global Burden of Diseases. The Global Burden of Chronic Diseases. Health Transition. Health Transition : is a concept that describes the change in disease patterns that occur during socio-economic development.

E N D
Global Health:The Global Burden of Diseases The Global Burden of Chronic Diseases
Health Transition Health Transition: is a concept that describes the change in disease patterns that occur during socio-economic development. Health Transition is composed by two interlinked components: epidemiologic transition and demographic transition.
The Epidemiologic Transition A transition from infectious disease to chronic, degenerative, or man-made diseases as the primary causes of mortality.
Causes of Epidemiologic Transition • 1. Socioeconomic development brings better nutrition, better housing, increased literacy, safe water and sanitation, and better living conditions. • 2. Modern health technology, access to vaccines and antibiotics. • 3. Cultural and behavior factors affecting hygiene, use of health service, tobacco, alcohol, safe sex, etc.
Theory of Epidemiologic Transition The theory of epidemiologic transition consists of the following premises: 1. Mortality is a fundamental factor in population dynamics. 2. During the transition, a long-term shift occurs in mortality and disease patterns whereby pandemics of infection are gradually displaced by degenerative and man-made diseases as the chief form of morbidity and primary cause of death. 3. During the epidemiologic transition the most profound changes in health and disease patterns obtain among children and young women. 4. The shift in health and disease patterns that characterize the epidemiologic transition are closely associated with the demographic and socioeconomic transition that constitute the modernization complex.
Four major successive stages of the epidemiologic transition: A) The Stage of Pestilence and Famine(today’s collapsed countries): when mortality is high and mainly determined by infectious diseases, malnutrition, and pregnancy & birth related disorders. Some of the infections, such as the plague and smallpox were spread in epidemics. Fertility rates are high. Population growth is slow or nonexistent because the high fertility is counterbalanced by high mortality. In this stage the average life expectancy at birth is low and variable, ranging between 20-40 years. Collapsed countries are Sierra Leone, Somalia, and Afghanistan.
Four major successive stages of the epidemiologic transition (cont.): B) The Stage of Receding Pandemics (today’s low income countries): when mortality declines but fertility remains high, with a resulting exponential population growth. The average life expectancy at birth increases steadily from about 30 to about 50 years. Larger epidemics become less frequent, but infectious diseases, maternal disorders, and malnutrition are still the main causes of mortality. Most of low and middle-income countries entered this stage in the end of the 1940s. Many of the low income countries are still at this stage today, especially those in Sub-Saharan Africa.
Four major successive stages of the epidemiologic transition (cont.): C) The Stage of Non-Communicable diseases (today’s middle-income countries) this stage is entered through socio-economic development, improved living conditions. With declining mortality due to infectious diseases, life expectancy at birth increases to 70 years of age and beyond. With an ageing population, the disease changes from a high prevalence of infectious diseases to a greater degree of chronic and NCD. Most middle-income countries in the world have entered this stage now. Some middle income countries are already in the fourth stage.
Four major successive stages of the epidemiologic transition (cont.): D) The Stage of delayed Degenerative Diseases (today’s high-income countries): when mortality due to IHD and cancer start to decrease. When tobacco smoking and dietary fat intake is reduced people will die from Alzheimer’s disease. Instead of suffering from heart attack and COPD people will live 10 years longer and then suffer from osteoporosis. Many high income countries will suffer from allergy, eating disorders, psychosocial diseases and chronic fatigue syndrome. Many high- income countries have low fertility far less than 2 children per women. This increases the elderly population and problems for caring for them.
The Demographic Transition The transition of a country from high birth rate and high death rates to low birth rate and low death rates.
Demographic Transition • Demographic transition is a theory that explains population change. It is a three stage pattern of population change that occurs as societies industrialize and urbanize. Demographic transition model is based on the change in crude birth rate (CBR) and crude death rate (CDR) over time. There are three stages (phases) of demographic transition: 1. Stage one: High birth rate, high death rate, and slow growth rate of a population characterize the first stage of demographic transition. Examples of nations that are in the first stage are Ethiopia, Angola, and Nigeria. 2. Stage two: High birth rates, but low death rates and skyrocketing growth rates of a population. Death rates decline because of better health conditions, improved medicine, better food, etc. Nations that are in the second stage include most of today’s Third World countries.
Demographic Transition 3. Stage three: Low birth rates, low death rates, and a stable population characterize the third stage. This stage includes most of Europe, Japan, and USA. Populations become more urban. Parents are encouraged to keep families small, in part, because children become an economic burden in advanced industrial societies. People are less dependent on their children as a personal labor force. Later in life, the state provides for social security.
Demographic Transition • Most developed countries are beyond stage three of the model. • The majority of developing countries are in stage two or stage three. • The major (relative) exceptions are some poor countries, mainly in Sub-Saharan Africa, and some Middle Eastern countries, which are poor or affected by government policy or civil war such as Pakistan, Palestine, Yemen and Afghanistan.
Demographic Transition Three different patterns of demographic transition have been described as: A) The Classical or Western model. Example: England and Wales. Socio-economically driven. Occurred over a period of almost 200 years. The classical model describes the gradual, progressive transition from high mortality and high fertility to low mortality and low fertility in most western European societies. Slow growth rate of the population was observed.
Demographic Transition B) The Accelerated model. Example: Japan. Medicine and technology driven. Lasted less than one century. Lower mortality rate and lower birth rate characterized this model. C) The Delayed model. Example: Sir Lanka. Population growth and medical advances driven. Low mortality and low birth rate but not rapid which kept the population growth high.
Changes in Life Expectancy Ref: The 2006 Revision and World Urbanization Prospects: The 2005 Revision, http://esa.un.org/unpp, Wednesday, March 12, 2008
The Epidemiologic Transition Ref: National Intelligence Council, The Global Infectious Disease Threat and Its Implications for the United States, 2000. Adapted.
Population Pyramid:Scotland, 1901 Ref: General Register Office for Scotland. Available at: www.gro-scotland.gov.uk/files/04fig2.4.gif. Accessed 12 February 2008.
Population Pyramid:Scotland, 2001 Ref: General Register Office for Scotland. Available at: www.gro-scotland.gov.uk/files/04fig2.4.gif. Accessed 12 February 2008.
Projected rankings for 15 leading Causes of Death, 2002 vs 2030 Ref: Mathers CD, Loncar D. PLoS Med. 2006 Nov;3(11):e442.
Projected rankings for Causes of Death, high vs low income, 2030 Ref: Mathers CD, Loncar D. PLoS Med. 2006 Nov;3(11):e442.
Projected foregone income due to early mortality from heart disease, stroke and diabetes, 2005–2015 Ref: WHO. Preventing chronic diseases: a vital investment (2005).
Driving the Demographic and Epidemiologic Transitions • Western model: driven gradually by economic, scientific, and technological development • New model: driven more rapidly by economic development plus rapid uptake of health-related science and technology
The New Risk Factors • Industrialization has led to Chronic Disease • Risk factors: • Smoking • Pollution • Automobiles • Diet • Sedentary lifestyle • Aging population • Urban migration
Most smokers live in developing countries Current smokers in 1995 (in millions) Region Number Low/Middle income 933 High Income 209 World 1,142 Quit rates low in low income countries • 5-10% in China, India • 30-40% in UK Source: Jha et al, 2002, AJPH
Large and growing number of deaths from smoking Past and future tobacco deaths (in billions) Time Billions of deaths 1901-2000 0.1 (mostly in developed countries) 2001-2100 1.0 (mostly in developing countries) • 0.5 B among people alive today • 1 in 2 of long-term smokers killed by their addiction • 1/2 of deaths in middle age (35-69) Source: Peto and Lopez, 2001
Obesity Brazil Prevalence of excess weight (Body Mass Index > 25) Population of 15 years of age in 15 Brazilian Capitals and FD 2002-2003
Mexico • From ’88 to ’99, in 2 - 4 year olds the rate of obesity or at risk • for obesity increased from 21.6% to 28.7% • 6-11 year olds, 21% obese or at risk for obesity • 24% of Mexican adults are obese • 8% of adults > 20 yr. old have type 2 Diabetes • 30% have HBP
MEXICO Figure 7 Changes in mean food purchases in 1996 (relative to 1994) by food group. Source: Rivera et al., 2004
Dietary energy from fat more than 30% CHINA Source: The China Economic Population Nutrition and Health Survey Sample size: 5789 (1989), 5838 (1991),5468 (1993), 5334 (1997), 4831 (2000), 4474 (2004)
MEXICO Figure 5 Mean Time dedicated to video viewing and physical activity, Mexico City Children 9-16 years old 1999 Ref: Mexico Nutrition Survey 1999
CHINA Number of color TV sets owned per 100 households year Urban rural 1985 17.21 1990 59.04 1995 89.79 16.92 1999 111.57 2000 116.56 48.74 2001 120.52 54.41 2002 126.38 2003 130.50 Source: State Statistical Bureau, China Statistical Yearbook, 1985-2005
CHINA Ref: Yangfeng Wu; Overweight & obesity in China, website: bmj.com 19 Aug 2006
Shifts in the BMI distribution for Chinese men, 1989–2000 Ref: Wang H, Du S, Zhai F, Popkin BM. Trends in the distribution of body mass index among Chinese adults, aged 20–45 years (1989–2000). International Journal of Obesity 31(2007):272–278.
India Metabolic Syndrome – 5 to 50% prevalence - insulin resistance - glucose intolerance - abdominal obesity - hyper insulinemic - hyper triglyceridemic
Projected Growth in Road Traffic Fatalities, 2002–2020 Ref: Mathers CD, Loncar D. Projections of global mortality and burden of disease from 2002 to 2030. PLoS Med. 2006 Nov;3(11):e442.
Global Prevalence of Mental Health Disorders Ref: Prince M, Patel V, Saxena S, et al. No health without mental health. Lancet. 2007;370:859-877.
The Behavioral Transition An increase in individual and collective behaviors, promoted and spread by global communication, that leads to the increased prevalence of unwanted health outcomes. The behavioral transition has led to an increase in “communicated diseases.”
Communicable Disease Model HOST VECTOR AGENT
Communicated Disease Model? HOST VECTOR AGENT
Communicable: Communicated: AGENTS Micro organisms - viruses - bacteria - parasites Food Drink Tobacco Inactivity Communicable/Communicated Diseases
Communicable: Communicated: Vectors Insects Media Sports TV/Cinema Social pressure Communicable/Communicated Diseases
Communicable: Communicated: Environmental Conditions Global warming Increased affluence Urbanization Communicable/Communicated Diseases
Communicable: Communicated: Socio-cultural Context Waste disposal Hygiene Coughing etiquette No smoking places Value of activity Safe driving/roads Communicable/Communicated Diseases
Communicated Diseases • obesity • motor vehicle collisions and injuries • decreased fitness and activity • CHD • diabetes • hypertension • stroke • many cancers • chronic lung disease
Interventions Community health promotion School base programs Legislation/regulation Taxation Mass media Partnerships Government leadership