Download
1 / 50
500 likes | 504 Views
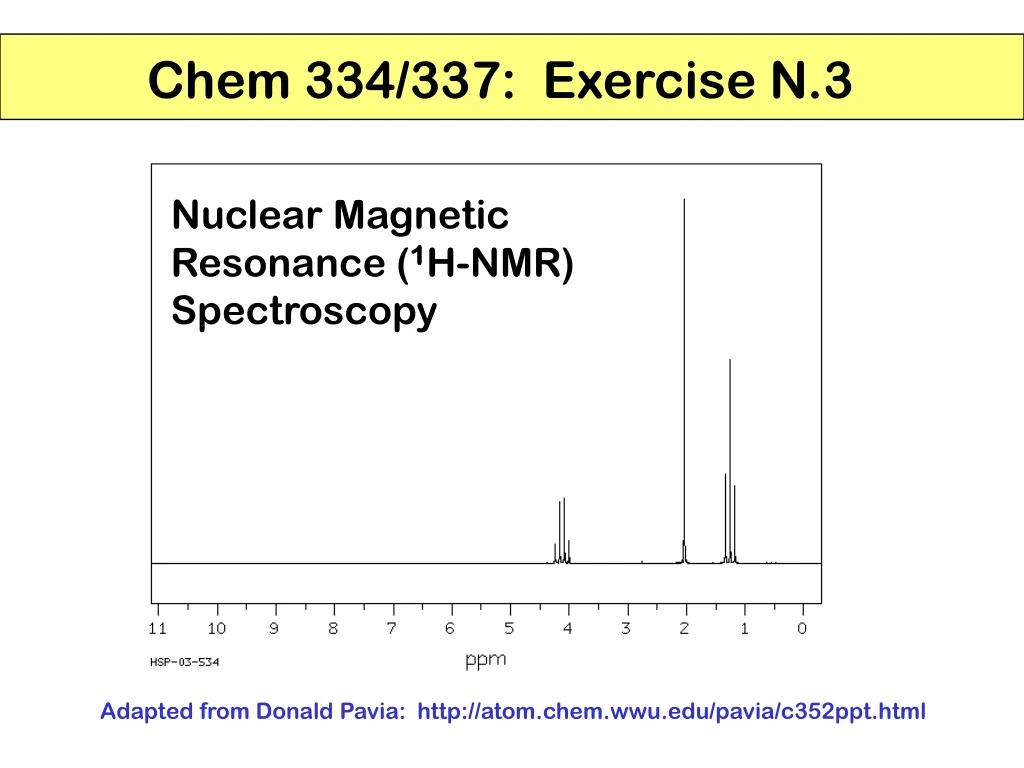
Nuclear Magnetic Resonance ( 1 H-NMR) Spectroscopy. Chem 334/337: Exercise N.3. Adapted from Donald Pavia: http://atom.chem.wwu.edu/pavia/c352ppt.html. Exercise N.3. Prelab Read Carey, Ch. 13 Review 13 C NMR notes from last semester Lab notebook No entries required Datasheet

E N D
Nuclear Magnetic Resonance (1H-NMR) Spectroscopy Chem 334/337: Exercise N.3 Adapted from Donald Pavia: http://atom.chem.wwu.edu/pavia/c352ppt.html
Exercise N.3 • Prelab • Read Carey, Ch. 13 • Review 13C NMR notes from last semester • Lab notebook • No entries required • Datasheet • Spectra handout (in class)
TYPES OF INFORMATION FROM THE 1H NMR SPECTRUM 1. Each different type of hydrogen gives a signal. 2. The chemical shift (d, in ppm) gives a clue as to the type of hydrogen generating the signal (alkane, alkene, benzene, aldehyde, etc.) 3. The integral gives the relative numbers of each type of hydrogen in a particular signal. 4. Spin-spin splitting gives the number of hydrogens on adjacent carbons. 5. The coupling constant J also gives information about the arrangement of the atoms involved.
1H NMR Number of signals– different types of protons Chemical shift– electronic environment Integration – number of equivalent protons in each signal Splitting – number of protons on adjacent carbons 13C NMR Number of signals– different types ofcarbons Chemical shift – electronic environment Integration– not done Splitting– not seen in decoupled spectra Comparison of 1H NMR & 13C NMR
# signals = # types of protons Integration = # protons in each signal 3 H Splitting patterns tell number of protons on adjacent carbons 3 H 2 H Chemical shift tells electronic environment
Nuclear “Spin” (angular momentum) R • Spin • A fundamental property of nature like electrical charge or mass • Comes in multiples of ½ and can be + or – • Protons, neutrons, and electrons all possess angular momentum (spin) • + and – spins can pair up and eliminate the observed manifestation of spin • When placed in a magnetic field, a nucleus with net spin can absorb a photon
R The “Resonance” Phenomenon Resonance – a transition between two energy states by the absorption of a photon A particle (electron, nucleus, molecule, etc) in the lower energy state absorbs a photon and ends up in the upper energy state. The energy of this photon must exactly match the energy difference between the two states. E = hν Infrared spectroscopy – two vibrational states NMR – two nuclear spin states
Nuclear Spin States - Hydrogen Nucleus R The two states are equivalent in energy in the absence of a magnetic or an electric field. + ½ α • ½ • β
The Energy Separation Depends On Bo R (Zeeman Effect) β degenerate at Bo = 0 α Bo increasing magnetic field strength γ is called the gyromagnetic ratio and is unique for each nuclide.
R Nuclear Spin Energy Levels N β In a magnetic field the two spin states differ in energy (although by a very small amount). unaligned 499,999 nuclei α aligned Bo S 500,001 nuclei
R Absorption of Energy quantized β β DE DE = hn α α Bo
1H and 13C Frequencies Differ For a given field strength 1H has its resonance at a different (higher) frequency than 13C. Divide the hydrogen frequency by 4 (approximately) 1H for carbon-13 1.41 T 60 MHz 2.35 T 100 MHz 13C 7.05 T 300 MHz 1.41 T 15.1 MHz 2.35 T 25.0 MHz 7.05 T 75.0 MHz
During an NMR Experiment R Apply an external magnetic field This causes the protons (hydrogen nuclei) to precess at an angular frequency Then apply a short pulse (~ 5 microseconds) of radio frequency energy If the frequency of photons in the pulse match the precessional frequency of the spinning nuclei, the photon is absorbed and the nucleus moves from the low energy spin state to the high energy spin state. (Resonance) The spectrometer detects the energy absorption and converts it to a graphical display
That’s really cool, but so what?? • Won’t all the protons precess at the same frequency? • (Which would lead to the same resonance frequency for all the protons, which leads to one peak in the spectrum) • In other words, isn’t it a nice experiment that doesn’t tell us much? • NO!! It turns out the protons precess at different frequencies in most molecules. • So they have different resonance frequencies. • Why is this the case??? R
R Electron Shielding • Nuclei are surrounded by an electron cloud • Shields the nucleus from full force of Bo • So the magnetic field experienced by the nucleus is less than the applied field Bo Bnucleus = Bapplied - Bshielding • Amount of shielding varies depending on the particular electronic environment of the nucleus
R Electron Shielding • Electronegative atoms such as halogens or oxygen pull electron density a way from the protons, leaving them more “exposed” • “Deshielding” • Changes the electronic environment of the protons • Leads to different precessional frequencies in a magnetic field • Leads to different resonance frequencies Bottom line: nuclei in different electronic environments will have different resonance frequencies due to varying degrees of shielding.
R THE CHEMICAL SHIFT “” the shift observed depends on the frequency of the instrument used tetramethylsilane TMS reference cmpound TMS (CH3)4Si shift in Hz parts per million n 0 Position of signal – position of TMS peak = = ppm x 106 spectrometer frequency in MHz this division gives a number independant of the instrument used
Electronegativity Dependence of Chemical Shift Deshielding increases
Substitution Effects on Chemical Shift CH3Br CH3Cl CHCl3 CH2Cl2 CH3Cl CH3F 7.3 5.3 3.1 ppm 4.3 3.1 2.7 ppm -CH2-Br -CH2-CH2Br -CH2-CH2CH2Br 3.3 1.7 1.3 ppm
NMR Correlation Charts • Lab text: • p. 128 (chart), • p. 129 table, • inside back cover • Carey: • Chapter 13, table 13.1
Number of Signals Number of signals = number of different types of hydrogens in a molecule
Types of Hydrogens 1 type = 1 signal 2 types = 2 signals
Types of Hydrogens 2 signals 2 signals 4 signals
INTEGRATION Integration = determination of the area under a peak The area under a peak is proportional to the number of hydrogens that generate the peak.
Benzyl Acetate 55 : 22 : 33 = 5 : 2 : 3
Benzyl Acetate (FT-NMR) actually : 5 2 3 21.215 / 11.3 = 1.90 33.929 / 11.3 = 3.00 58.117 / 11.3 = 5.14 assume CH3 33.929 / 3 = 11.3
Spin-Spin Splitting NMR Spectrum of Bromoethane a b a b
NMR Spectrum of Acetaldehyde a a b b offset = 2.0 ppm
NMR Spectrum of 2-Nitropropane b a a a b
Spin-spin Splitting Protons that have the same chemical shift do not split each other’s signal. The basis for spin-spin splitting is spin-spin coupling – the communication of nuclear spin information via the electrons in the bonds between the nuclei. Coupling is greatest when the number of intervening bonds is small. Vicinal protons are separated by three bonds. So the coupling is sometimes referred to as vicinal coupling or three-bond coupling.
Some Common Splitting Patterns (n+1 rule) ( x = y ) ( x = y )
SPIN ARRANGEMENTS one neighbor n+1 = 2 doublet one neighbor n+1 = 2 doublet H H H H C C C C yellow spins blue spins The resonance pattern (splitting) of a given hydrogen is affected by the possible spins of its neighbor.
SPIN ARRANGEMENTS two neighbors n+1 = 3 triplet one neighbor n+1 = 2 doublet methine spins methylene spins
H H H H H H C C C C H H H H SPIN ARRANGEMENTS three neighbors n+1 = 4 quartet two neighbors n+1 = 3 triplet methylene spins methyl spins
triplet = 2 adjacent hydrogens singlet = 0 adjacent hydrogens quartet = 3 adjacent hydrogens
PASCAL’S TRIANGLE The interior entries are the sums of the two numbers immediately above. 1 singlet 1 1 doublet 1 2 1 triplet 1 3 3 1 quartet 1 4 6 4 1 quintet 1 5 10 10 5 1 sextet 1 6 15 20 15 6 1 septet 1 7 21 35 35 21 7 1 octet
THE COUPLING CONSTANT J J J J J J The coupling constant is the distance J (measured in Hz) between the peaks in a multiplet. J is a measure of the amount of interaction between the two sets of hydrogens creating the multiplet.
Some Representative Coupling Constants 6 to 8 Hz three bond 3J 11 to 18 Hz three bond 3J trans 6 to 15 Hz three bond 3J cis 0 to 5 Hz two bond 2J geminal Hax,Hax = 8 to 14 Hax,Heq = 0 to 7 three bond 3J Heq,Heq = 0 to 5
cis 6 to 12 Hz three bond 3J trans 4 to 8 Hz 4 to 10 Hz three bond 3J 0 to 3 Hz four bond 4J 0 to 3 Hz four bond 4J Couplings that occur at distances greater than three bonds are called long-range couplings and they are usually small (<3 Hz) and frequently nonexistent (0 Hz).
Protons on Heteroatoms Oxygen and Nitrogen • Chemical shift is temperature and concentration dependent • Usually don’t show splitting because of rapid exchange with other molecules • Amines = 1-3 • Alcohols = 0.5-5 • Phenols = 6-8 • Carboxylic Acids = 10-13
MODERN INSTRUMENTATION typical today PULSED FOURIER TRANSFORM TECHNOLOGY FT-NMR requires a computer
Pulse Sequence (Typical 1-dimensional pulse) Relaxation delay Preparation time Detection time Waiting for all the molecules to come to equilibrium Excite the molecules with an Rf pulse Detect the signal (~5µs) Time About 2 seconds total The entire sequence is often repeated hundreds of times to increase the signal to noise ratio.
PULSED EXCITATION N n2 n1 RF PULSE n3 S All types of hydrogen are excited simultaneously with the single RF pulse.
FREE INDUCTION DECAY n1 n2 n3
COMPOSITE FID (“time domain“ spectrum) n1 + n2 + n3 + ...... time
Signal amplitude as a function of time (composite FID) Fourier Transform “mathemagic” Signal amplitude as a function of frequency.
General Approach to NMR Problems • If the formula is known, calculate the degree of unsaturation (p. 140) U = ((2C+2)-H)/2 • Examine the spectrum and look for the number of signals • Tells you the number of types of protons • Integrate the spectrum • Use the chemical shift of each group to get an idea of the functional groups • Needs to be consistent with formula!! • Look for characteristic splitting patterns • Put it all together – find a structure consistent with all the data
Sample Problem 1 Unsaturation No. of kinds of H Integration Types of H () Splitting (n+1) Identity C4H9Cl 0.9, triplet (3H) 1.4, sextet (2H) 1.7, pentet (2H) 3.4, triplet (2H)
Sample Problem 2 Unsaturation No. of kinds of H Integration Types of H () Splitting (n+1) Identity • C8H8O • 2.5, singlet (3H) • 7.2-7.8, 2 doublets (4H) • 10.0, singlet (1H)
Sample Problem 3 Unsaturation No. of kinds of H Integration Types of H () Splitting (n+1) Identity • C8H10O • 1.4, triplet (3H) • 3.96, quartet (2H) • 6.9, multiplet (2H) • 7.2, multiplet (3H)