Download
1 / 24
240 likes | 358 Views
Albumin MIP Prepared in Aqueous Solution System. Speaker : Thong-Yueh Lin 報告者 : 林 聰 樂. Outline. Introduction Experimental Results and discussion Conclusions. Introduction. Property of Albumin. Half-life: 17 to 23 day Molecular weight: 68,000 Isoelectric point: 4.8

E N D
Albumin MIP Prepared in Aqueous Solution System Speaker : Thong-Yueh Lin 報告者 : 林 聰 樂
Outline • Introduction • Experimental • Results and discussion • Conclusions
Property of Albumin • Half-life: 17 to 23 day • Molecular weight: 68,000 • Isoelectric point: 4.8 • Concentration of human serum: 3.0 to 5.0 g/dl
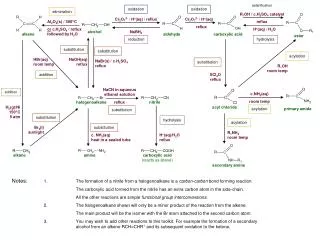
Materials Monomer 3-dimethylaminopropyl metacrlamide:DMAPMA acrylamide:AM Allylamine:AA Methacrylic acid:MAA Hydroxy ethyl methacrylate:HEMA
Materials Crosslinking agent Tetraethylene glycol dimethacrylate:TEGDMA Polyethylene glycol dimethacrylate:PEGDMA
Materials Initiators Ammonium persulfate:APS Cumene hydroperoxide:CHP Tetramethyl ethylenediamine:TMEDA
Fabrication Sequence of MIP Preparation of MIP crush of MIP Washing with 20 wt.% methanol and drying of MIP Screening of MIP
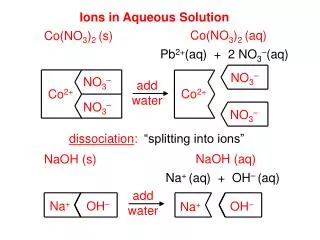
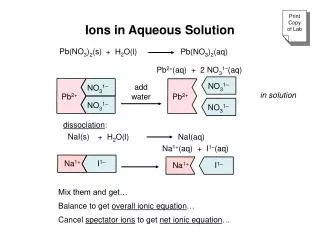
Selectivity mass ratio to adsorbent of M.I.P Sample name: DMAPMA-TEGDMA Albumin 4.5% Water 10.4% DMAPMA 5.0% TEGDMA 80% APS,TMEDA Selectivity: 1:1.9:14.2:1.4
Selectivity mass ratio to adsorbent of M.I.P Sample name: MAA-TEGDMA Albumin 3.1% Water 7.3% MAA 2.7% TEGDMA 86.8% APS,TMEDA Selectivity: 52.2:160.1:1:77.5
Selectivity mass ratio to adsorbent of M.I.P Sample name: AM-TEGDMA 1 Albumin 2.4% Water 9.2% AM 2.4% TEGDMA 86% APS,TMEDA Selectivity: 1:4.1:6.5:2.5
Selectivity mass ratio to adsorbent of M.I.P Sample name: AM-TEGDMA 2 Albumin 2.4% Water 11.2% AM 2.3% TEGDMA 84% CHP,TMEDA Selectivity 4.4:25.8:8.9:1
Selectivity mass ratio to adsorbent of M.I.P Sample name: HEMA-PEGDMA Albumin 4.5% Water 10.5% HEMA 5.1% PEGDMA 80% APS,TMEDA Selectivity 1: 4.3: 1: 1.8
Selectivity mass ratio to adsorbent of M.I.P Sample name: DMAPMA-PEGDMA Albumin 5.4% Water 12.6% DMAPMA 6.0% PEGDMA 76% APS,TMEDA Selectivity 3.1:6.4:5.4:1
Conclusions The DMAPMA-TEGDMA MIP can obtain high selectivity for albumin 2.The mass ratio of DMAPMA-TEGDMA MIP for adsorbent = Albumin : Lysozyme : Myoglobin : Cytochrome C = 14.2 : 1.9 : 1.4 : 1