Download
1 / 61
610 likes | 741 Views
Test Review. Heart. Pulmonary trunk. Fibrous pericardium. Parietal layer of serous pericardium. Pericardium. Pericardial cavity. Myocardium. Epicardium (visceral layer of serous pericardium). Heart wall. Myocardium. Endocardium. Heart chamber. Figure 18.2.

E N D
Test Review Heart
Pulmonary trunk Fibrous pericardium Parietal layer of serous pericardium Pericardium Pericardial cavity Myocardium Epicardium (visceral layer of serous pericardium) Heart wall Myocardium Endocardium Heart chamber Figure 18.2
Layers of the Heart Wall • Epicardium—visceral layer of the serous pericardium
Layers of the Heart Wall • Myocardium • Spiral bundles of cardiac muscle cells • Fibrous skeleton of the heart: crisscrossing, interlacing layer of connective tissue • Anchors cardiac muscle fibers • Supports great vessels and valves • Limits spread of action potentials to specific paths
Layers of the Heart Wall • Endocardium is continuous with endothelial lining of blood vessels
Chambers • Four chambers • Two atria • Separated internally by the interatrial septum • Coronary sulcus (atrioventricular groove) encircles the junction of the atria and ventricles • Auricles increase atrial volume
Chambers • Two ventricles • Separated by the interventricular septum • Anterior and posterior interventricular sulci mark the position of the septum externally
Left common carotid artery Brachiocephalic trunk Left subclavian artery Superior vena cava Aortic arch Ligamentum arteriosum Right pulmonary artery Left pulmonary artery Ascending aorta Left pulmonary veins Pulmonary trunk Right pulmonary veins Auricle of left atrium Circumflex artery Right atrium Left coronary artery (in coronary sulcus) Right coronary artery (in coronary sulcus) Anterior cardiac vein Left ventricle Right ventricle Great cardiac vein Right marginal artery Anterior interventricular artery (in anterior interventricular sulcus) Small cardiac vein Inferior vena cava Apex (b) Anterior view Figure 18.4b
Aorta Left pulmonary artery Superior vena cava Left atrium Right pulmonary artery Left pulmonary veins Pulmonary trunk Right atrium Mitral (bicuspid) valve Right pulmonary veins Fossa ovalis Aortic valve Pectinate muscles Pulmonary valve Tricuspid valve Left ventricle Papillary muscle Right ventricle Interventricular septum Chordae tendineae Trabeculae carneae Epicardium Inferior vena cava Myocardium Endocardium (e) Frontal section Figure 18.4e
Atria: The Receiving Chambers • Walls are ridged by pectinate muscles • Vessels entering right atrium • Superior vena cava • Inferior vena cava • Coronary sinus • Vessels entering left atrium • Right and left pulmonary veins
Ventricles: The Discharging Chambers • Walls are ridged by trabeculae carneae • Papillary muscles project into the ventricular cavities • Vessel leaving the right ventricle • Pulmonary trunk • Vessel leaving the left ventricle • Aorta
Pathway of Blood Through the Heart • The heart is two side-by-side pumps • Right side is the pump for the pulmonary circuit • Vessels that carry blood to and from the lungs • Left side is the pump for the systemic circuit • Vessels that carry the blood to and from all body tissues
Capillary beds of lungs where gas exchange occurs Pulmonary Circuit Pulmonary veins Pulmonary arteries Aorta and branches Venae cavae Left atrium Left ventricle Right atrium Heart Right ventricle Systemic Circuit Oxygen-rich, CO2-poor blood Capillary beds of all body tissues where gas exchange occurs Oxygen-poor, CO2-rich blood Figure 18.5
Pathway of Blood Through the Heart • Right atrium tricuspid valve right ventricle • Right ventricle pulmonary semilunar valve pulmonary trunk pulmonary arteries lungs
Pathway of Blood Through the Heart • Lungs pulmonary veins left atrium • Left atrium bicuspid valve left ventricle • Left ventricle aortic semilunar valve aorta • Aorta systemic circulation
Pathway of Blood Through the Heart • Equal volumes of blood are pumped to the pulmonary and systemic circuits • Pulmonary circuit is a short, low-pressure circulation • Systemic circuit blood encounters much resistance in the long pathways • Anatomy of the ventricles reflects these differences
Homeostatic Imbalances • Angina pectoris • Thoracic pain caused by a fleeting deficiency in blood delivery to the myocardium • Cells are weakened • Myocardial infarction (heart attack) • Prolonged coronary blockage • Areas of cell death are repaired with noncontractile scar tissue
Heart Valves • Ensure unidirectional blood flow through the heart • Atrioventricular (AV) valves • Prevent backflow into the atria when ventricles contract • Tricuspid valve (right) • Mitral valve (left) • Chordae tendineae anchor AV valve cusps to papillary muscles
Heart Valves • Semilunar (SL) valves • Prevent backflow into the ventricles when ventricles relax • Aortic semilunar valve • Pulmonary semilunar valve
Pulmonary valve Myocardium Aortic valve Tricuspid (right atrioventricular) valve Area of cutaway Mitral valve Tricuspid valve Mitral (left atrioventricular) valve Myocardium Tricuspid (right atrioventricular) valve Aortic valve Mitral (left atrioventricular) valve Pulmonary valve Aortic valve Pulmonary valve Aortic valve Pulmonary valve Area of cutaway (b) Fibrous skeleton Mitral valve Tricuspid valve (a) Anterior Figure 18.8a
Opening of inferior vena cava Mitral valve Chordae tendineae Tricuspid valve Myocardium of right ventricle Myocardium of left ventricle Pulmonary valve Aortic valve Area of cutaway Papillary muscles Mitral valve Interventricular septum Tricuspid valve (d) Figure 18.8d
1 Blood returning to the heart fills atria, putting pressure against atrioventricular valves; atrioventricular valves are forced open. Direction of blood flow Atrium Cusp of atrioventricular valve (open) 2 As ventricles fill, atrioventricular valve flaps hang limply into ventricles. Chordae tendineae 3 Atria contract, forcing additional blood into ventricles. Papillary muscle Ventricle (a) AV valves open; atrial pressure greater than ventricular pressure Atrium 1 Ventricles contract, forcing blood against atrioventricular valve cusps. Cusps of atrioventricular valve (closed) 2 Atrioventricular valves close. Blood in ventricle 3 Papillary muscles contract and chordae tendineae tighten, preventing valve flaps from everting into atria. (b) AV valves closed; atrial pressure less than ventricular pressure Figure 18.9
Aorta Pulmonary trunk As ventricles contract and intraventricular pressure rises, blood is pushed up against semilunar valves, forcing them open. (a) Semilunar valves open As ventricles relax and intraventricular pressure falls, blood flows back from arteries, filling the cusps of semilunar valves and forcing them to close. (b) Semilunar valves closed Figure 18.10
Microscopic Anatomy of Cardiac Muscle • Cardiac muscle cells are striated, short, fat, branched, and interconnected • Connective tissue matrix (endomysium) connects to the fibrous skeleton • T tubules are wide but less numerous; SR is simpler than in skeletal muscle • Numerous large mitochondria (25–35% of cell volume)
Nucleus Intercalated discs Cardiac muscle cell Gap junctions Desmosomes (a) Figure 18.11a
Microscopic Anatomy of Cardiac Muscle • Intercalated discs: junctions between cells anchor cardiac cells • Desmosomes prevent cells from separating during contraction • Gap junctions allow ions to pass; electrically couple adjacent cells • Heart muscle behaves as a functional syncytium
Cardiac muscle cell Mitochondrion Intercalated disc Nucleus T tubule Mitochondrion Sarcoplasmic reticulum Z disc Nucleus Sarcolemma I band I band A band (b) Figure 18.11b
Cardiac Muscle Contraction • Depolarization of the heart is rhythmic and spontaneous • About 1% of cardiac cells have automaticity— (are self-excitable) • Gap junctions ensure the heart contracts as a unit • Long absolute refractory period (250 ms)
Cardiac Muscle Contraction • Depolarization opens voltage-gated fast Na+ channels in the sarcolemma • Reversal of membrane potential from –90 mV to +30 mV • Depolarization wave in T tubules causes the SR to release Ca2+ • Depolarization wave also opens slow Ca2+ channels in the sarcolemma • Ca2+ surge prolongs the depolarization phase (plateau)
1 Action potential Depolarizationis due to Na+influx through fast voltage-gated Na+ channels. A positive feedback cycle rapidly opens many Na+ channels, reversing the membrane potential. Channel inactivation ends this phase. Plateau 2 Tension development (contraction) Membrane potential (mV) 3 Tension (g) 1 2 Plateau phaseis due to Ca2+ influx through slow Ca2+channels. This keeps the cell depolarized because few K+channels are open. Absolute refractory period 3 Repolarizationis due to Ca2+channels inactivating and K+ channels opening. This allows K+efflux, which brings the membrane potential back to its resting voltage. Time (ms) Figure 18.12
Cardiac Muscle Contraction • Ca2+ influx triggers opening of Ca2+-sensitive channels in the SR, which liberates bursts of Ca2+ • E-C coupling occurs as Ca2+ binds to troponin and sliding of the filaments begins • Duration of the AP and the contractile phase is much greater in cardiac muscle than in skeletal muscle • Repolarization results from inactivation of Ca2+ channels and opening of voltage-gated K+ channels
Heart Physiology: Electrical Events • Intrinsic cardiac conduction system • A network of noncontractile (autorhythmic) cells that initiate and distribute impulses to coordinate the depolarization and contraction of the heart
Autorhythmic Cells • Have unstable resting potentials (pacemaker potentials or prepotentials) due to open slow Na+ channels • At threshold, Ca2+ channels open • Explosive Ca2+ influx produces the rising phase of the action potential • Repolarization results from inactivation of Ca2+ channels and opening of voltage-gated K+ channels
Threshold Action potential 2 2 3 1 1 Pacemaker potential 3 2 1 Repolarization is due to Ca2+ channels inactivating and K+ channels opening. This allows K+ efflux, which brings the membrane potential back to its most negative voltage. Depolarization The action potential begins when the pacemaker potential reaches threshold. Depolarization is due to Ca2+ influx through Ca2+ channels. Pacemaker potential This slow depolarization is due to both opening of Na+ channels and closing of K+ channels. Notice that the membrane potential is never a flat line. Figure 18.13
Superior vena cava Right atrium Thesinoatrial (SA) node(pacemaker) generates impulses. 1 Internodal pathway Left atrium 2 The impulses pause (0.1 s) at the atrioventricular (AV) node. Purkinje fibers Theatrioventricular (AV) bundle connects the atria to the ventricles. 3 Thebundle branches conduct the impulses through the interventricular septum. 4 Inter- ventricular septum ThePurkinje fibers depolarize the contractile cells of both ventricles. 5 (a) Anatomy of the intrinsic conduction system showing the sequence of electrical excitation Figure 18.14a
Homeostatic Imbalances • Defective SA node may result in • Ectopic focus: abnormal pacemaker takes over • If AV node takes over, there will be a junctional rhythm (40–60 bpm) • Defective AV node may result in • Partial or total heart block • Few or no impulses from SA node reach the ventricles
Extrinsic Innervation of the Heart • Heartbeat is modified by the ANS • Cardiac centers are located in the medulla oblongata • Cardioacceleratory center innervates SA and AV nodes, heart muscle, and coronary arteries through sympathetic neurons • Cardioinhibitory center inhibits SA and AV nodes through parasympathetic fibers in the vagus nerves
Dorsal motor nucleus of vagus The vagus nerve (parasympathetic) decreases heart rate. Cardioinhibitory center Medulla oblongata Cardio- acceleratory center Sympathetic trunk ganglion Thoracic spinal cord Sympathetic trunk Sympathetic cardiac nervesincrease heart rate and force of contraction. AV node SA node Parasympathetic fibers Sympathetic fibers Interneurons Figure 18.15
Electrocardiography • Electrocardiogram (ECG or EKG): a composite of all the action potentials generated by nodal and contractile cells at a given time • Three waves • P wave: depolarization of SA node • QRS complex: ventricular depolarization • T wave: ventricular repolarization
QRS complex Sinoatrial node Ventricular depolarization Ventricular repolarization Atrial depolarization Atrioventricular node S-T Segment P-Q Interval Q-T Interval Figure 18.16
Depolarization Repolarization SA node R R T P T P Q S 1 Atrial depolarization, initiatedby the SA node, causes theP wave. Q S 4 Ventricular depolarizationis complete. R AV node R T P T P Q S Q 2 With atrial depolarizationcomplete, the impulse isdelayed at the AV node. S 5 Ventricular repolarizationbegins at apex, causing theT wave. R R T P T P Q S Q S 3 Ventricular depolarizationbegins at apex, causing theQRS complex. Atrialrepolarization occurs. 6 Ventricular repolarizationis complete. Figure 18.17
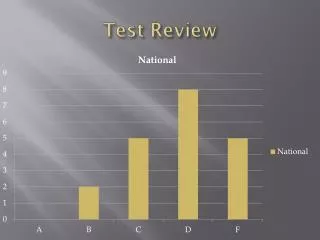
(a) Normal sinus rhythm. (b) Junctional rhythm. The SA node is nonfunctional, P waves are absent, and heart is paced by the AV node at 40 - 60 beats/min. (d) Ventricular fibrillation. These chaotic, grossly irregular ECG deflections are seen in acute heart attack and electrical shock. (c) Second-degree heart block. Some P waves are not conducted through the AV node; hence more P than QRS waves are seen. In this tracing, the ratio of P waves to QRS waves is mostly 2:1. Figure 18.18
Heart Sounds • Two sounds (lub-dup) associated with closing of heart valves • First sound occurs as AV valves close and signifies beginning of systole • Second sound occurs when SL valves close at the beginning of ventricular diastole • Heart murmurs: abnormal heart sounds most often indicative of valve problems
Aortic valvesounds heard in 2nd intercostal space at right sternal margin Pulmonary valve sounds heard in 2nd intercostal space at left sternal margin Mitral valvesounds heard over heart apex (in 5th intercostal space) in line with middle of clavicle Tricuspid valvesounds typically heard in right sternal margin of 5th intercostal space Figure 18.19
Mechanical Events: The Cardiac Cycle • Cardiac cycle: all events associated with blood flow through the heart during one complete heartbeat • Systole—contraction • Diastole—relaxation
Phases of the Cardiac Cycle • Ventricular filling—takes place in mid-to-late diastole • AV valves are open • 80% of blood passively flows into ventricles • Atrial systole occurs, delivering the remaining 20% • End diastolic volume (EDV): volume of blood in each ventricle at the end of ventricular diastole
Phases of the Cardiac Cycle • Ventricular systole • Atria relax and ventricles begin to contract • Rising ventricular pressure results in closing of AV valves • Isovolumetric contraction phase (all valves are closed) • In ejection phase, ventricular pressure exceeds pressure in the large arteries, forcing the SL valves open • End systolic volume (ESV): volume of blood remaining in each ventricle
Phases of the Cardiac Cycle • Isovolumetric relaxation occurs in early diastole • Ventricles relax • Backflow of blood in aorta and pulmonary trunk closes SL valves and causes dicrotic notch (brief rise in aortic pressure)
Left heart QRS P T P Electrocardiogram 1st 2nd Heart sounds Dicrotic notch Aorta Pressure (mm Hg) Left ventricle Atrial systole Left atrium EDV Ventricular volume (ml) SV ESV Atrioventricular valves Open Closed Open Aortic and pulmonary valves Closed Open Closed Phase 1 2a 2b 3 1 Left atrium Right atrium Left ventricle Right ventricle Ventricular filling Atrial contraction Ventricular ejection phase Isovolumetric relaxation Ventricular filling Isovolumetric contraction phase 1 2a 2b 3 Ventricular filling (mid-to-late diastole) Ventricular systole (atria in diastole) Early diastole Figure 18.20
Cardiac Output (CO) • Volume of blood pumped by each ventricle in one minute • CO = heart rate (HR) x stroke volume (SV) • HR = number of beats per minute • SV = volume of blood pumped out by a ventricle with each beat