Download
1 / 39
390 likes | 539 Views
Automated Techniques to Map Headwaters Stream Networks in the Piedmont Ecoregion of North Carolina. Valerie Garcia Forestry Department, North Carolina State University Office of Research and Development, Environmental Protection Agency August 4, 2004. Why is the research important?

E N D
Automated Techniques to Map Headwaters Stream Networks in the Piedmont Ecoregion of North Carolina Valerie Garcia Forestry Department, North Carolina State University Office of Research and Development, Environmental Protection Agency August 4, 2004
Why is the research important? • A large percentage of non-point source pollution is suspected to occur through headwaters streams • Current available USGS 1:24,000 Topographic maps lack accuracy in depicting the presence and location of headwaters streams • The lack of accurate maps for headwaters streams places an inordinate burden on both the regulatory agencies and the regulated communities in planning and implementing policy
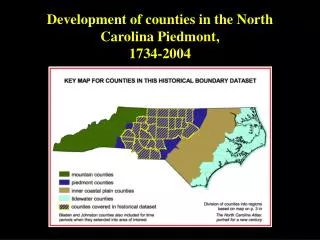
Why is the research important? • Recent availability of LIDAR data for portions of North Carolina provide new opportunities for developing more accurate stream maps • This study focuses on the mapping of headwaters stream networks using Geographical Information System (GIS) approaches and LIDAR data • Study results limited to the Piedmont Ecoregion of North Carolina
Layout of Study • Phase I: Extensive literature search to investigate state-of-science Geographical Information System (GIS) approaches relevant for using LIDAR data to map headwaters streams • Phase II: Compare and evaluate approaches identified through the literature search by applying the techniques to a study site in the Piedmont Ecoregion of North Carolina
Some Definitions… • Triangulated Irregular Network (TIN) • Digital Elevation Model (DEM) • Hydro-enforcement
Triangulated Irregular Network (TIN): Formulation of non-overlapping triangles from irregularly spaced x, y, and z points (vector-based)
Digital Elevation Model (DEM): As used in this study…uniformly spaced, 3-dimensional cartographic representation (x, y, z) in a grid or raster format
Hydro-Enforcement • Both TINs and DEMs result in artifacts—artificial disruptions of the natural drainage of water • Incorporation of known stream center-lines (breaklines) into the modeled terrain ensure the downstream drainage of water
Summary of Literature Search • Findings fell into two major categories • Production of accurate topographic maps • Extraction of stream networks • TINs produce more precise topographic maps • maintains LIDAR elevation points as triangle vertices • better retains linear structures (breaklines) • DEMs are better for automatically extracting headwaters streams • can automatically correct drainage problems and determine stream origin
Summary of Literature Search • The interpolation method and the resolution used to generate the topographic map can impact the accuracy of the map • more complex interpolation methods (e.g., Spline, Kriging) require more knowledge and are computationally demanding, but are expected to perform better in modeling terrain • resolution drives computation demands of the interpolation method and can impact the selection of which interpolation method can be used
Summary of Literature Search • Hydro-enforcement of the DEM enhances the accuracy of the extracted stream networks • derived from orthophotos (can be expensive) • typically not available for headwaters streams • Physical processes relevant at headwaters stream scales are different than watershed scales typically modeled • stream origin and hillslope (diffuse) flow are critical at headwaters stream scales
Phase II: Application of Stream Mapping Techniques to Study Site in Falls Lake, North Carolina
Research Questions • What is the accuracy of the LIDAR surface elevation points? • When using densely spaced LIDAR data, does the interpolation method used to create a DEM make a difference in the accuracy of the DEM? • At what resolution do you begin to lose channel definition of headwaters streams, thereby affecting the production of headwaters stream maps? • Does using breakline data to hydro-enforce TINs and DEMs make a difference in the production of headwaters stream maps? • Do more complex stream flow algorithms and stream origin approaches produce better results than simpler methods in mapping headwaters streams? [not covered in this presentation]
Method Steps Step 1: Evaluate the accuracy of LIDAR surface elevation points Step 2: Compare the accuracy of topographic maps generated using various interpolation methods Step 3: Evaluate the effect of scaling on topographic and stream map accuracy Step 4: Assess the impact of using hydro-enforcement to extract stream networks
Study Site • Forested headwater stream catchment near Falls Lake in the Piedmont Ecoregion of North Carolina was selected as the study site • Collected surveyed elevation points and mapping grade Global Positioning System (GPS) along headwater stream • All modeling techniques were run for the study site and compared against survey data and available ancillary data
GIS Applications Used in Study • ArcGIS used to generate topographic maps • Four interpolation methods compared: Natural Neighbor, Inverse Distance Weighting (IDW), Spline and Kriging • Four resolutions compared: 10 ft., 20 ft., 60 ft., 90 ft. • ArcHydro used to extract stream networks • Networks extracted with and without hydro-enforcement • Networks extracted at four resolutions: 10 ft., 20 ft., 60 ft., 90 ft.
Data Used in Study • Existing data used in modeling • LIDAR mass elevation points (NC State Floodplain Mapping Program, 2003) • Breakline data (stream centerlines and shorelines) (NC State Floodplain Mapping Program, 2003) • Data used for comparisons • Field-collected data (survey, mapping-grade GPS) • Medium and high resolution National Hydrography Dataset (NHD) (2000) • USGS 1:24,000 Topographic Digital Raster Graph (DRG) (1994) • Wake County Hydrography Lines (2000) derived from 1:12,000 aerial photography • 1999 Wake County Color Digital Orthophotography
Step 1: Evaluation of LIDAR Surface Elevation Points • Collection of high-accuracy ground truth data • Control Benchmarks established along ridge of study catchments (vertical +/- 2cm) • Transect surveyed across study catchment (vertical +/- 8cm) • GPS measurements taken along headwater stream (horizontal 1-2m) • Compared LIDAR data to field-collected survey points • TIN generated from LIDAR data (without breaklines) and used for comparison with survey data
Step 1: Evaluation of LIDAR Surface Elevation Points • RMSE was 1.32’ or 40.1 cm (no points removed) • Recalculated using the “95 percentile” methodology with adjusted RMSE of 28.7 cm • Published accuracy of LIDAR data is 25 cm (95 percentile) -- but study did not limit survey to uniform slope and used only one landcover type
Step 2: Comparison of Topographic Maps • Generated DEMs from LIDAR data using four different interpolation techniques and compared to ground-truth data • 20 ft. resolution used as LIDAR data averaged at least one point every 20 sq. ft. • Four interpolation methods compared (Natural Neighbor, IDW, Spline and Kriging) • Results compared to survey data
Step 2: Comparison of Topographic Maps IDW(brick), Kriging (majenta) vs. Survey Points (blue)
Step 2: Comparison of Topographic Maps Spline (red), Natural Neighbor (green) vs. Survey Points (blue)
Step 3: Evaluate Impact of Scaling to Various Resolutions • Evaluate impact of scaling on accuracy of topographic map • Natural Neighbor, IDW, and Regularized Spline used to generate 10 ft., 20 ft., 60 ft. and 90 ft. resolution DEMs • Results compared to survey data
Step 3: Evaluate Impact of Scaling to Various Resolutions • Evaluate impact of scaling on stream extraction • ArcHydro used to extract stream networks at various resolutions (10 ft., 20 ft., 60 ft. 90 ft.) • Extracted stream networks compared to each other, GPS points and Wake County hydrography lines
Step 3: Evaluate Impact of Scaling to Various Resolutions - DEM • Comparison of DEMs at different resolutions • Very little difference exists between the 10 ft. and 20 ft. resolution DEMs
Step 3: Evaluate Impact of Scaling to Various Resolutions – Stream Extraction • Comparison of DEMs at different resolutions • At 60 ft. resolution, 2 ft. headwater stream channel becomes a 120 ft. depression • At 90 ft. resolution, the entire drainage is lost
Impact of Scaling to Various Resolutions • Comparison of drainages extracted at different resolutions • Similar to the topographic map results, very little difference exists between the extracted stream drainages generated from the 10 ft. and 20 ft. resolution DEMs
Impact of Scaling to Various Resolutions • Comparison of drainages extracted at different resolutions • At 60 ft. resolution, drainage lines become much more unnaturally linear and have more occurrences of drainage interruptions • At 90 ft. resolution, this problem is more extreme
Step 4: Assess the effect of Hydro-enforcement on the Extraction of Stream Networks • Accuracy of source breakline data • Overlain on NHD, Wake County hydrography lines, Wake County digital orthophotography and USGS 1:24,000 Topographic DRG • Evaluate the impact of hydro-enforcement on extracting headwaters stream networks • ArcHydro used to extract stream networks for each DEM, with and without hydro-enforcement • Extracted networks compared to stream GPS points, NHD, Wake County hydrography lines, Wake County digital orthophotography and USGS 1:24,000 Topographic DRG
Step 4: Impact of Hydro-enforcement – Accuracy of Breakline Data • NC Floodplain Program breakline data aligns well with the 1999 Wake County digital orthophotography
Step 4: Impact of Hydro-enforcement – Accuracy of Breakline Data • NHD (high resolution (blue) and medium resolution (red)) aligns well with USGS 1:24,000 Topographic DRG
Step 4: Impact of Hydro-enforcement – Accuracy of Breakline Data • NHD (high resolution) does NOT align with 1999 orthophotography (beige polygons emphasize alignment problems)
Step 4: Impact of Hydro-Enforcement • Most of the differences were in the higher-order streams • The headwaters stream network was substantially the same regardless of whether the grid was hydro-enforced or not • Hydro-enforced Natural Neighbor DEM produced the cleanest drainage lines in the breakline areas Drainage created from hydro-enforced TIN (converted to grid) produces a confused drainage in the lake area
Step 4: Impact of Hydro-Enforcement “Best” drainage generated from Natural Neighbor DEM with hydro-enforcement (blue) overlain on Wake County hydrological lines (green)
Conclusions • Simpler interpolation methods (e.g., Nearest Neighbor, IDW) did as well or better than the more complex interpolation methods (e.g., Kriging) for generating the base DEMs that are used for extracting headwaters stream networks • Hydro-enforcement did not improve the results in extracting the headwaters stream networks • Hydro-enforcement did generate more direct drainages in the lake area, indicating that flatter areas or any area prone to flooding, will be aided by breakline data
Conclusions • Breakline data available through the NC State Floodplain Program are better aligned than currently available NHD or USGS 1:24,000 Topographic Map • Because misalignments are carried throughout the stream network, only the highest quality breakline data should be used for hydro-enforcement; alternatively, no hydro-enforcement should be used
Bottomline… For the study catchment—LIDAR data and GIS modeling approaches did a better job than the best stream data currently available for the area “Zooming in” shows that the model does better than the Wake County hydrography lines as compared to the GPS stream points