Download
1 / 35
350 likes | 357 Views
Fed Challenge 2008. Kristin Wall, Brendan G. Lynch, Kelly Rockwood, Slade Prendergast, James Marchant Steven Parad (Alternate). Federal Reserve System. The Federal Reserve Act states: - Maximum employment - Stable prices - Moderate long-term interest rates

E N D
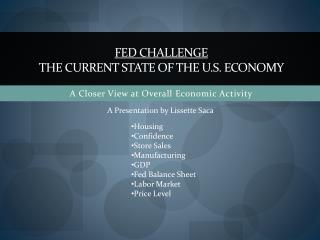
Fed Challenge 2008 Kristin Wall, Brendan G. Lynch, Kelly Rockwood, Slade Prendergast, James Marchant Steven Parad (Alternate) December 10, 2008
Federal Reserve System The Federal Reserve Act states: - Maximum employment - Stable prices - Moderate long-term interest rates - Stability of financial markets and institutions 1 Goals • - The Fed acts as a lender of last resort to • banks as a bankers’ bank. • Through monetary policy the Fed has influence • over the money supplyand theinterest rates. • The Fed conducts economic research and • promotes economic and financial literacy. Roles
Current Economic Condition 3 Bursting Housing Market Bubble Financial Market Turmoil, Wealth Effect, Panic Subprime Mortgage Related Assets Choke off Flow of the Credit Recession
Nominal and Real GDP (SAAR) 4 Real GDP -0.5% in 2008 Q3: Final sales down by 1.4% Durable goods consumption -15.2% (most since 1987) Nondurable goods -6.9% (most since 1950) % Nominal GDP Real GDP Source: Dept. of Commerce/BEA
CPI and Core CPI (3M percent changes) 5 CPI Core CPI Record CPI drop was caused by low energy priceand transportation costs. Source: BLS
New and Existing Home Sales 6 Existing Home Sales (1,000) New Home Sales (1,000) Existing home sales fell 3.1% annualized rateto 4.98 million. New single-family home sales fell 5.3% to an annual rate of 433,000 in Oct. Sources: National Association of Realtors, U.S. Census Bureau
Subprime Mortgages: Delinquency Rate and Percent in Foreclosure 7 Tightening credit, rising unemployment, a slowing economy have pushed up delinquency rates. Slight decline in foreclosures but 4.1% of all subprime mortgages entered the foreclosure process in Q3. Adj. Rate Mortgage Delinquency Rate Adj. Rate Mortgage % in Foreclosure Sources: Moody’s Economy.com, Mortgage Bankers Association
10 Major Cities House Value Change 8 % % Change from peak Sources: S&P/Case-Sheller, S&P % Change from year ago
Employment Situation: Jobs Created (payroll survey) 10 (1,000) Recession began in Dec. 2007 Employment started decline in January, significant drops in Oct., Nov. and Dec. Sources: Bureau of Labor Statistics, NBER
Employment Situation 11 Source: US Dept. of Labor, BLS
Rising Unemployment (Trough-to-Peak) during Recessions (% point) 12 In the current cycle, unemployment rate would rise to 8.8% and 9.6% to match jump observed in the 1970s and 1980s, respectively Sources: Bureau of Labor Statistics (BLS), National Bureau of Economic Research (NBER)
Equity Market 13 S&P 500 has dropped by 48% since Oct. 2007 Volatility index VIX (investor fear index) is elevated Sources: Chicago Board Options Exchange (CBOE), Standard and Poor’s
Commercial Paper Yield Spreads over Federal Funds Rate 14 Significant improvement since early Nov. 2008 Investors lost appetite for risky/illiquid assets. Conditions improved, but still not back to normal. Spike after Lehman failure Close to zero before Aug. 2007 Source: Federal Reserve Board
The Conference BoardConsumer Confidence Index 15 The index rose to 44.9 from its record-low Oct’s 38.8. It is lower than 1992 and 1980 level but above Dec. 1974’s 43.2 (1985=100) U of Michigan’s Consumer Sentiment Index declined 2.3 pts to 55.3, lowest level since 1980 Q2. Consumers are watching their jobs, wealth and ability to borrow. Sources: The Conference Board, Moody’s Economy.com
Japanese Overnight Rate Source: Moody’s Economy.com 16 % No reaction Not aggressive and slow reaction
U.S. vs. Japanese Case Bursting of a real estate bubble and the resulting financial market turmoil. Real estate has constituted a smaller share of total assets in the U.S. Smaller decline in equity wealth in the U.S. Smaller Wealth Effect Faster population growth in the U.S. larger long-term demand for housing. 17 Similarities Differences
U.S. vs. Japanese Case 18 • Different public policy reactions. • No reaction/wait-and-see policyat the beginning of the Japanese economic crisis. • Swift policy reaction in the U.S. • Fed Chairman Ben S. Bernanke is one of the leading authorities on the Great Depressioninnovative methods to avoid deflation. Differences - Continued
Swift Policy Response The Fed picked aggressive, flexible, and innovative monetary policy. Auction funds for terms up to a month. Lend treasuries against mortgage-backed securities (MBS). Allowed non-bank securities market brokers and dealer to borrow at the discount window. Rapid response of Fiscal policy: stimulus package, $700b bailout package, more stimulus to come The U.S. economy will not have a “Lost Decade.” 19
Target FFR and Fed’s Efforts Sources: FRB St. Louis, Board of Governor 20 Unscheduled meeting 75bp rate cut Unscheduled meeting 50bp rate cut TSLF Created MMIFF Created TAF and FX swap Created TALF Created PDCF Created CPFF Created
Target Fed Funds Rates and Effective Fed Funds Rates Source: Federal Reserve Board 21 Fed begins paying Interest on reserves % Target FFR Effective FFR Interest on reserves will act as a floor on Effective FFR but not yet effective
OPEC Spot Price and Retail Price (Weekly) Sources: Energy Information Administration, OPEC 22 Regular Retail Gasoline Price Crude Oil Price Peaked on July 4: $137.18 Crude Oil (OPEC) Spot Price Extraordinary Meeting, Oct. 24 Emergency Meeting, Nov. 29
Why we can avoid Deflation We see negative inflation as a result of a relative price change (energy!) but not yet widespread deflation (core inflation dropped 0.1% in October but that drop is mostly due to transportation). Monetary easing and fiscal stimulus are inflationary Fed learned lessons from Japan’s passive or delayed monetary policy reaction: Timely and innovative monetary policy thanks to Fed chairman Ben S. Bernanke 23
Forecast of GDP 24 GDP is the sum of the components Sources: Dept. of Commerce, Bureau of Economic Analysis, Census Bureau, FRB Dallas, BLS, USASpending.gov
Assumptions underlying Forecast - PCE drops by a cumulative 3%: By quarter: -4%, -4%, -3%, -1% SAAR in Q3, Q4, Q1 and Q2, flat in Q2, then recovers in 2009Q3. Weak near-term outlook due to bad labor market and weak consumer credit. - Nonresidential Structures keep expanding moderately (2% SAAR), but due to their small share, they cannot save the day - Equipment and software investment contracts sharply in Q4, Q1, then recovers by 2009Q3 - Residential fixed investment keeps contracting double digit in Q4 and Q1, then finds a bottom in 2009Q3. - Inventories: Volatile and hard to forecast: set to zero - Government uses massive stimulus: 6% SAAR in 2008Q4-2009Q2, back to 3% growth in 2009Q3 - Net exports buoy growth: imports contract, exports grow at 2% SAAR. Trade deficit shrinks to 4% by 2009Q3 (from 4.88% in 2008Q3). 25
Overall Economic Outlook After a contraction in real GDP (-0.5%) in Q3 sharper decline in Q4. Growth in the first half of 2009 is likely to be weak. Expect improvement starting Q3 in 2009. Unemployment rate will rise to above 8%, no recovery until late 2009 (labor market lags when the economy leaves a recession) Housing market bottoms out in 2009 Q2. In late 2009, real GDP growth will be back to its trend of 2.7%. U.S. economy still faces significant financial stress and the economic outlook remains highly uncertain. 26
Actions 27 Monetary Policy Federal Funds Rate, Innovative lending facilities Healthy & Normal Economy Weak Economy High Unemployment, Slow/negative Growth, Panic and Liquidity Problem Fiscal Policy Bailouts, Tax cut
Recommendations No inflationary pressures yet, thus Fed has the latitude to lower the FFR to 0.50% at the upcoming meeting If further monetary stimulus is needed, Fed can consider buying Treasury securities, as suggested in the chairman’s speech on Dec 1, 2008 28
Q & A Thank You 29
References and Data Sources 30 - Quarterly data for GDP: Bureau of Economic Analysis (BEA) - Weekly jobless claims: U.S. Department of Labor, Employment and Training Administration - Daily Yield data: Board of Governors of the Federal Reserve System. - Dismal Scientist (Dismal Economy.com) - The Federal Reserve Bank of Boston, NY, Philadelphia, Cleveland, St. Louis, Kansas City, Dallas, San Francisco, and Minneapolis - Economic Research, JP Morgan - Forecast of the Nation, Georgia State Univ. - Chicago Board Options Exchange (CBOE) - Standard and Poor’s - Hubbard & O’Brien, Macroeconomics, 3rd ed. - Mortgage Bankers Association
References and Data Sources 31 - Bernard Baumohl, The Secrets of Economic Indicators, 2ed - The Wall Street Journal - CIA the World Factbook - Economic Review, The Federal Reserve Bank of Kansas City - Energy Information Administration (EIA) - The Energy Information Agency (EIA) - The International Energy Agency (IEA) - U.S. Department of Commerce. Bureau of the Census - National Association of Home Builders (NAHB) - National Association of Realtors (NAR) - National Bureau of Economic Research (NBER) - USAspending.gov - Consulates: Sweden and Japan
Appendix-Swedish CPI Source: Moody’s Economy.com 32 High inflation
Appendix-Swedish Interest Rates Source: Moody’s Economy.com 33 Raised Interest Rates
Appendix-U.S. vs. Swedish Case - Real estate bubble and has burst and financial turmoil. (1992-96) 34 Similarities • The U.S. subprime crisis is centered • around private homes where as Swedish • turmoil mainly involved in commercial real • estate. • There was rampant inflation in Sweden • prior to the crisis. Banks were borrowing • cheaply in the international market and • lending at a higher rate domestically. • Raised interest rate in Sweden. Differences